Ethereum recorded a reasonably significant drop towards the end of last month. However, the token has since recovered considerably well, and was valued at press time at around $190. At the time of writing, ETH had a daily trading volume of over $9.45 billion and a total market cap of near $20.4 billion
Hourly chart
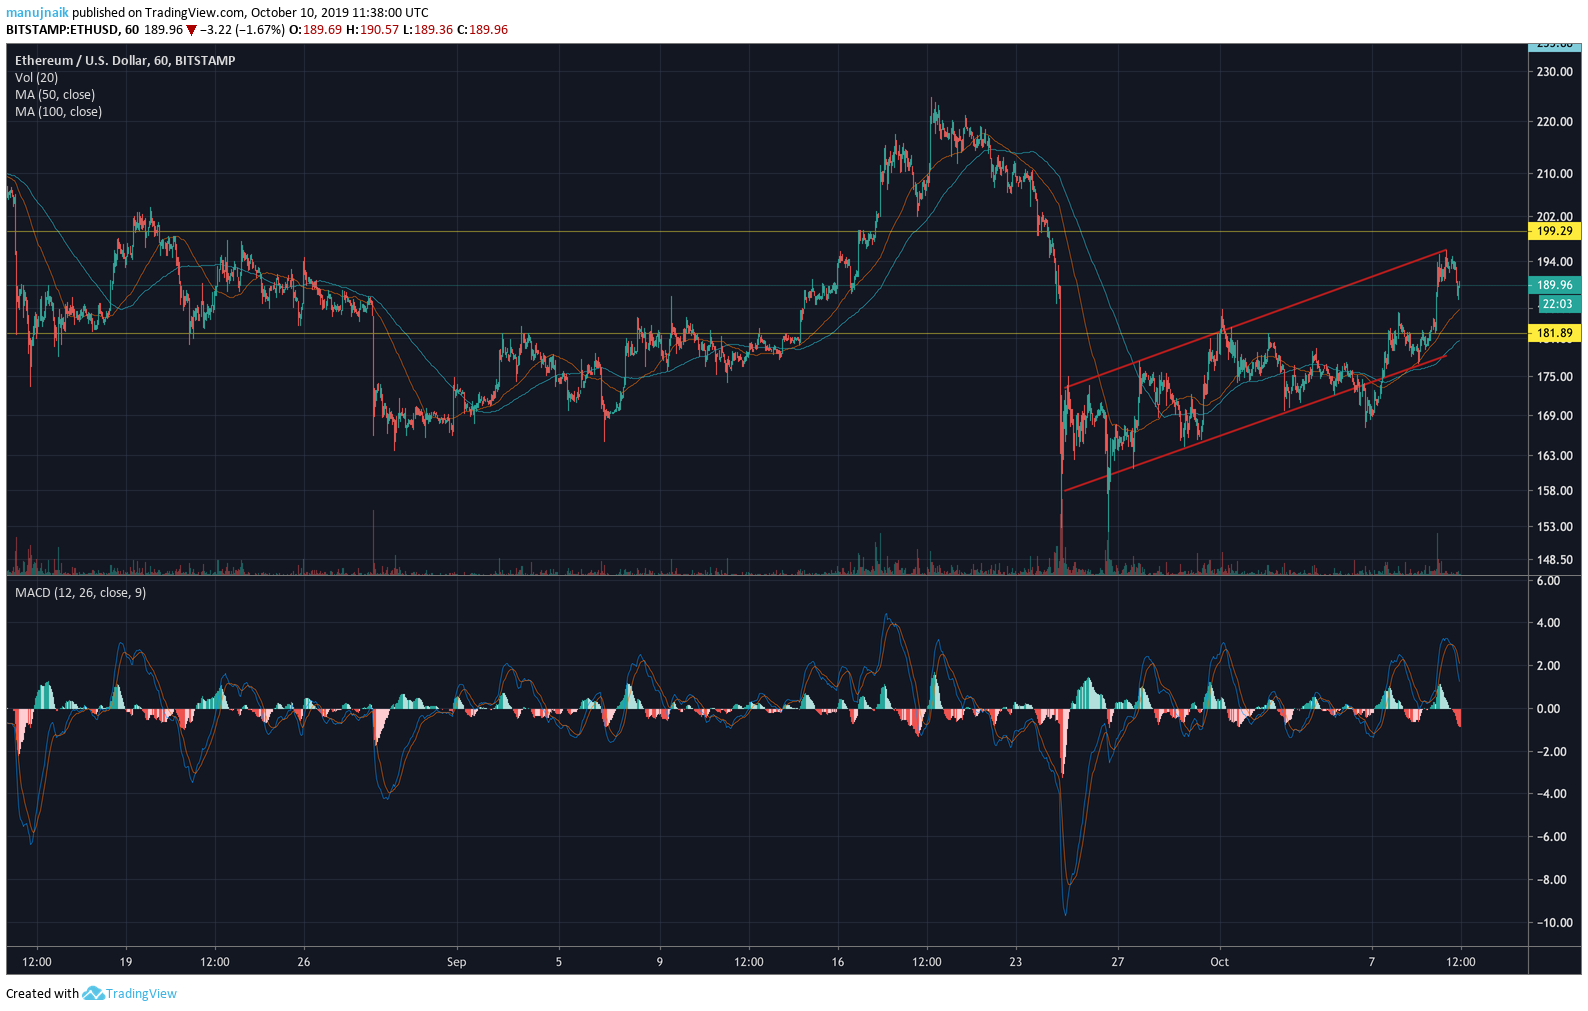
Source: ETHUSD on TradingView
The 1-hour chart for ETH’s price against USD shows a loose flag pattern, with the market’s decreasing volumes supporting this perspective. With the signal line having crossed above the MACD line and the moving averages below the price trend looking to make a crossover, the price could move further down in the next few hours.
4-hour chart
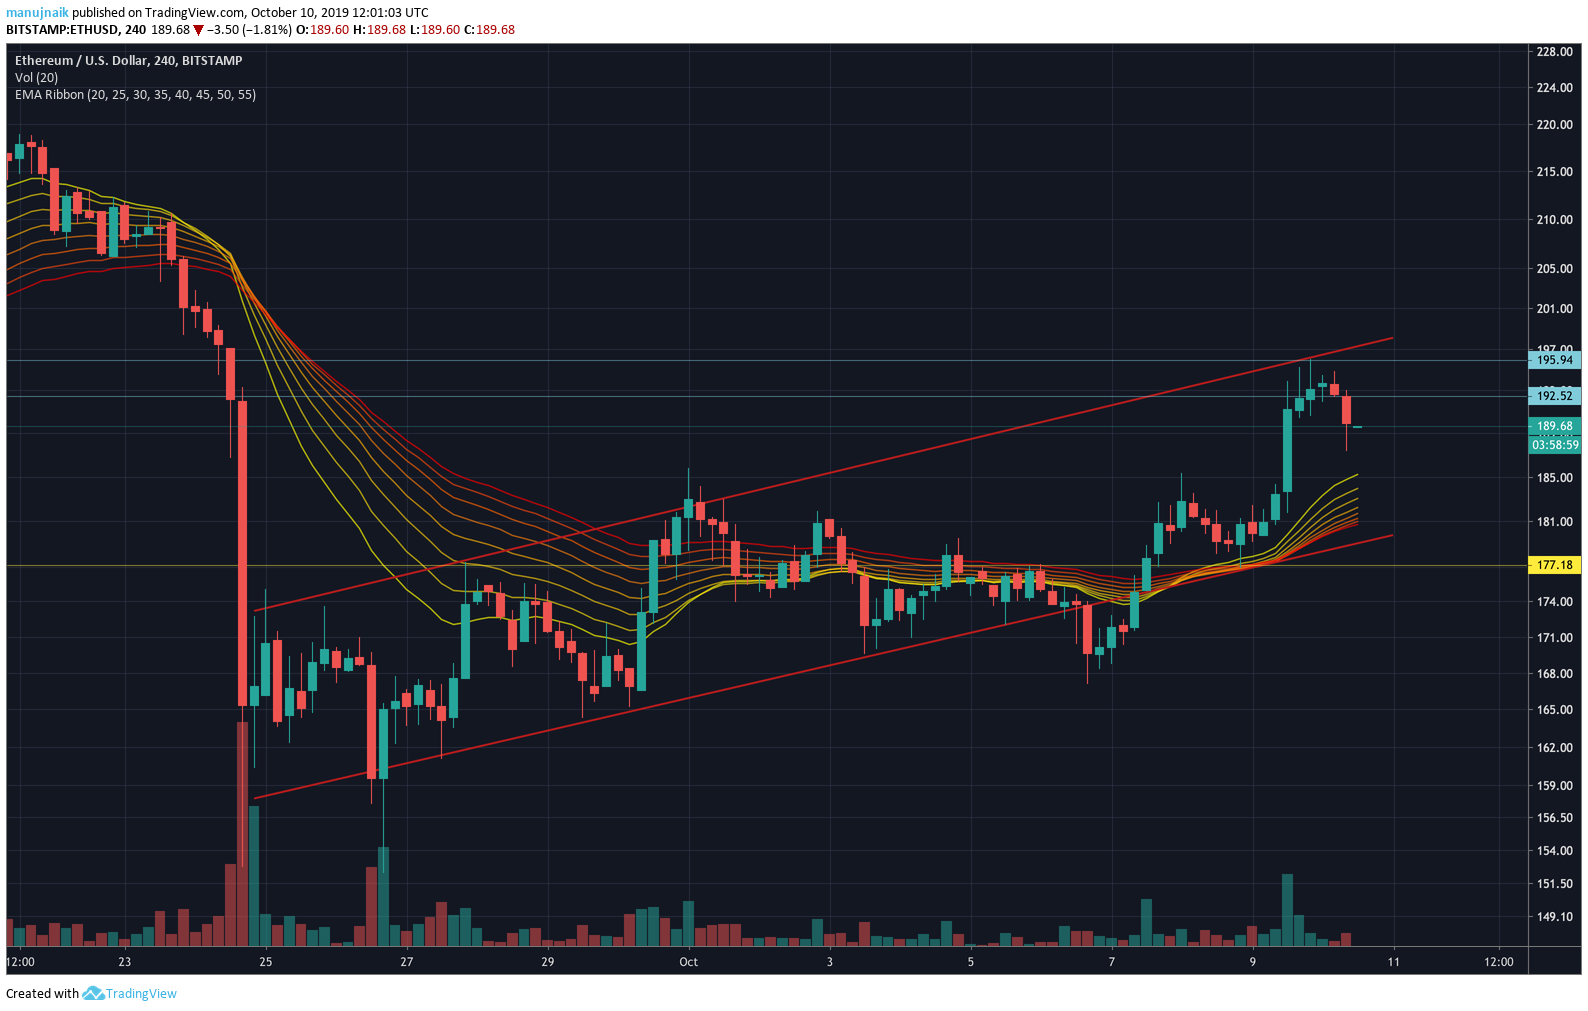
Source: ETHUSD on TradingView
A closer look at the 4-hour chart shows the price moving over the EMA ribbon lines, indicating possible bullish movement in the short-term. Flag patterns also generally tend to breakout in the upwards direction, making it even more likely that the price will go up.
It is within reason to believe that the price of the Ethereum will go down for a few days, moving within the flag pattern, till it hits the $182 mark. Around the middle of next week however, we could see a breakout upwards towards $200.