
After a ~26% rise in value between the 17th and 18th of September, XRP’s 33% crash over the next 6 days shook the community, as the coin saw lows last seen over two years prior. Despite a relatively impressive boost from $0.22 to more than $0.31 over the next month and a half, it’s safe to say November was not kind to XRP.
XRP touched another staggering 2-year low at $0.18 post the near 44% decline over the 40 days since November 7, and was valued at around $0.19 at the time of writing.
XRP 1-day chart
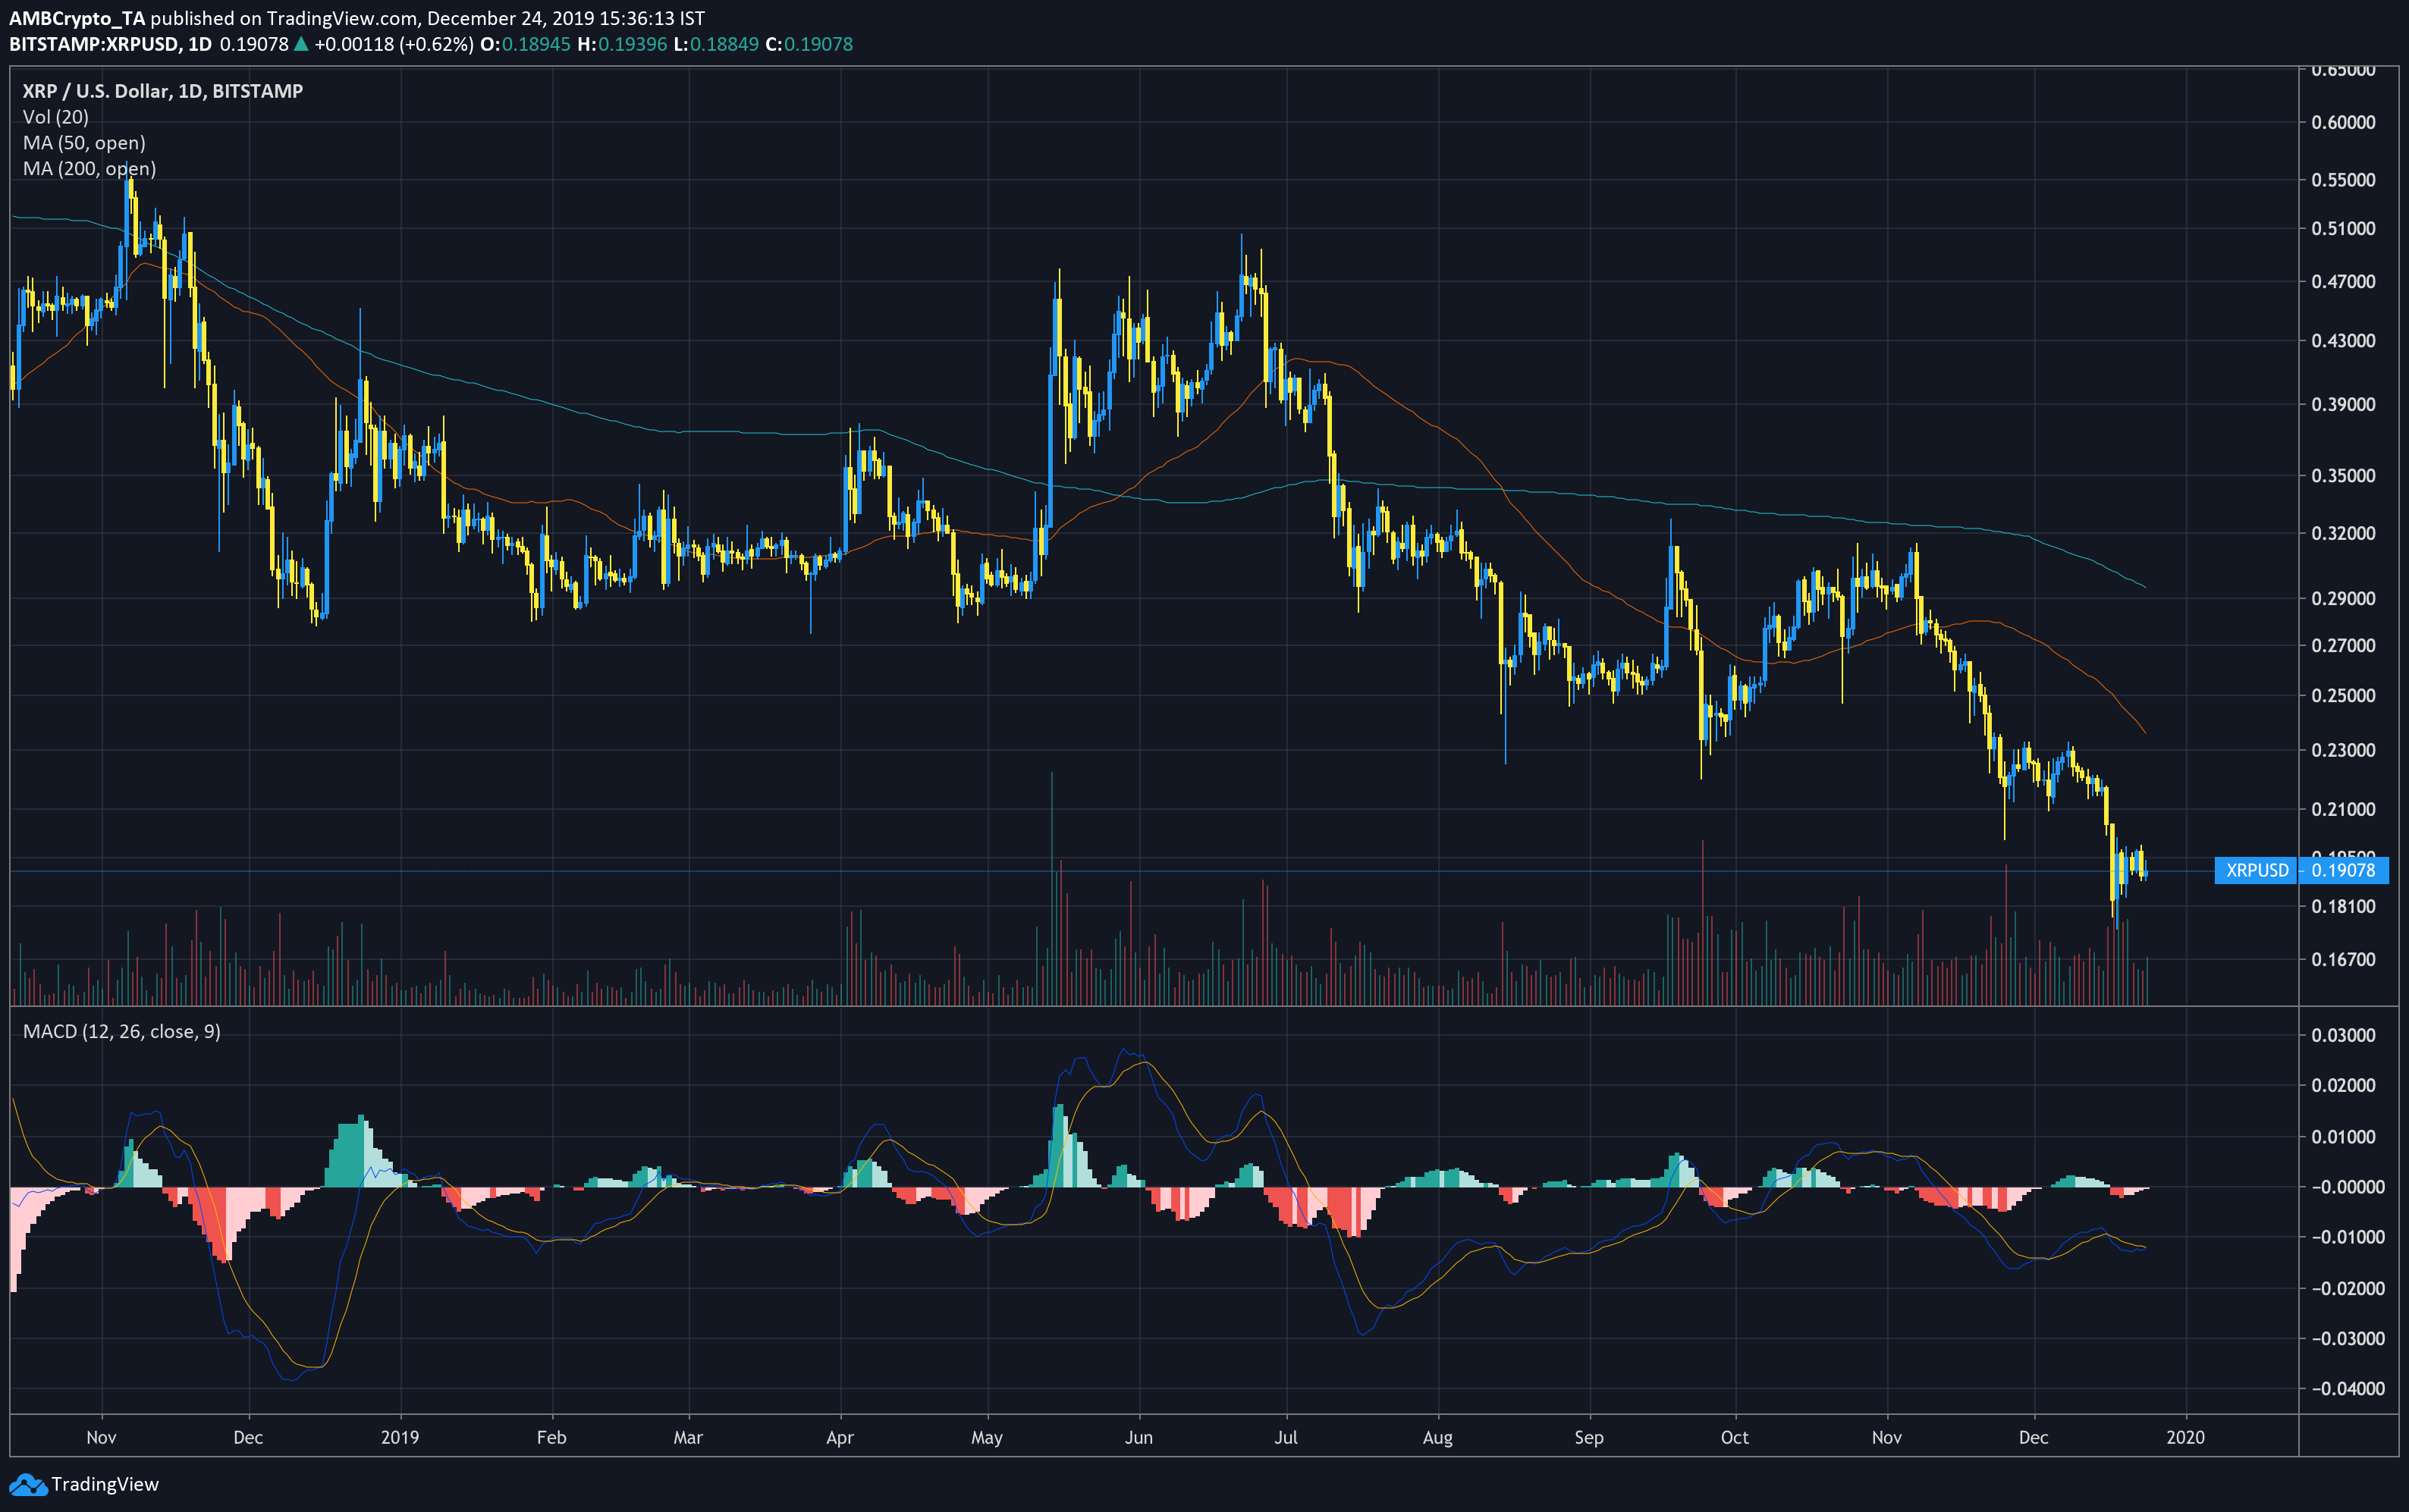
Source: XRPUSD on TradingView
In the long-term, XRP looks bearish, with the 50 and 200-day moving averages zooming far above the current price after a death cross in mid-August. MACD also showed greater bearish prospects for the coin in the longer-term. However, on a shorter time-scale, XRP looks far more bullish.
CoinMetrics data showed that correlation of XRP with BTC has reached around 0.72, having steadily increased from 0.46 in late-October. Bitcoin’s recent unprecedented downward break from an ascending triangle pattern was closely followed by a short-term pump, which XRP could mimic if the price drops further.
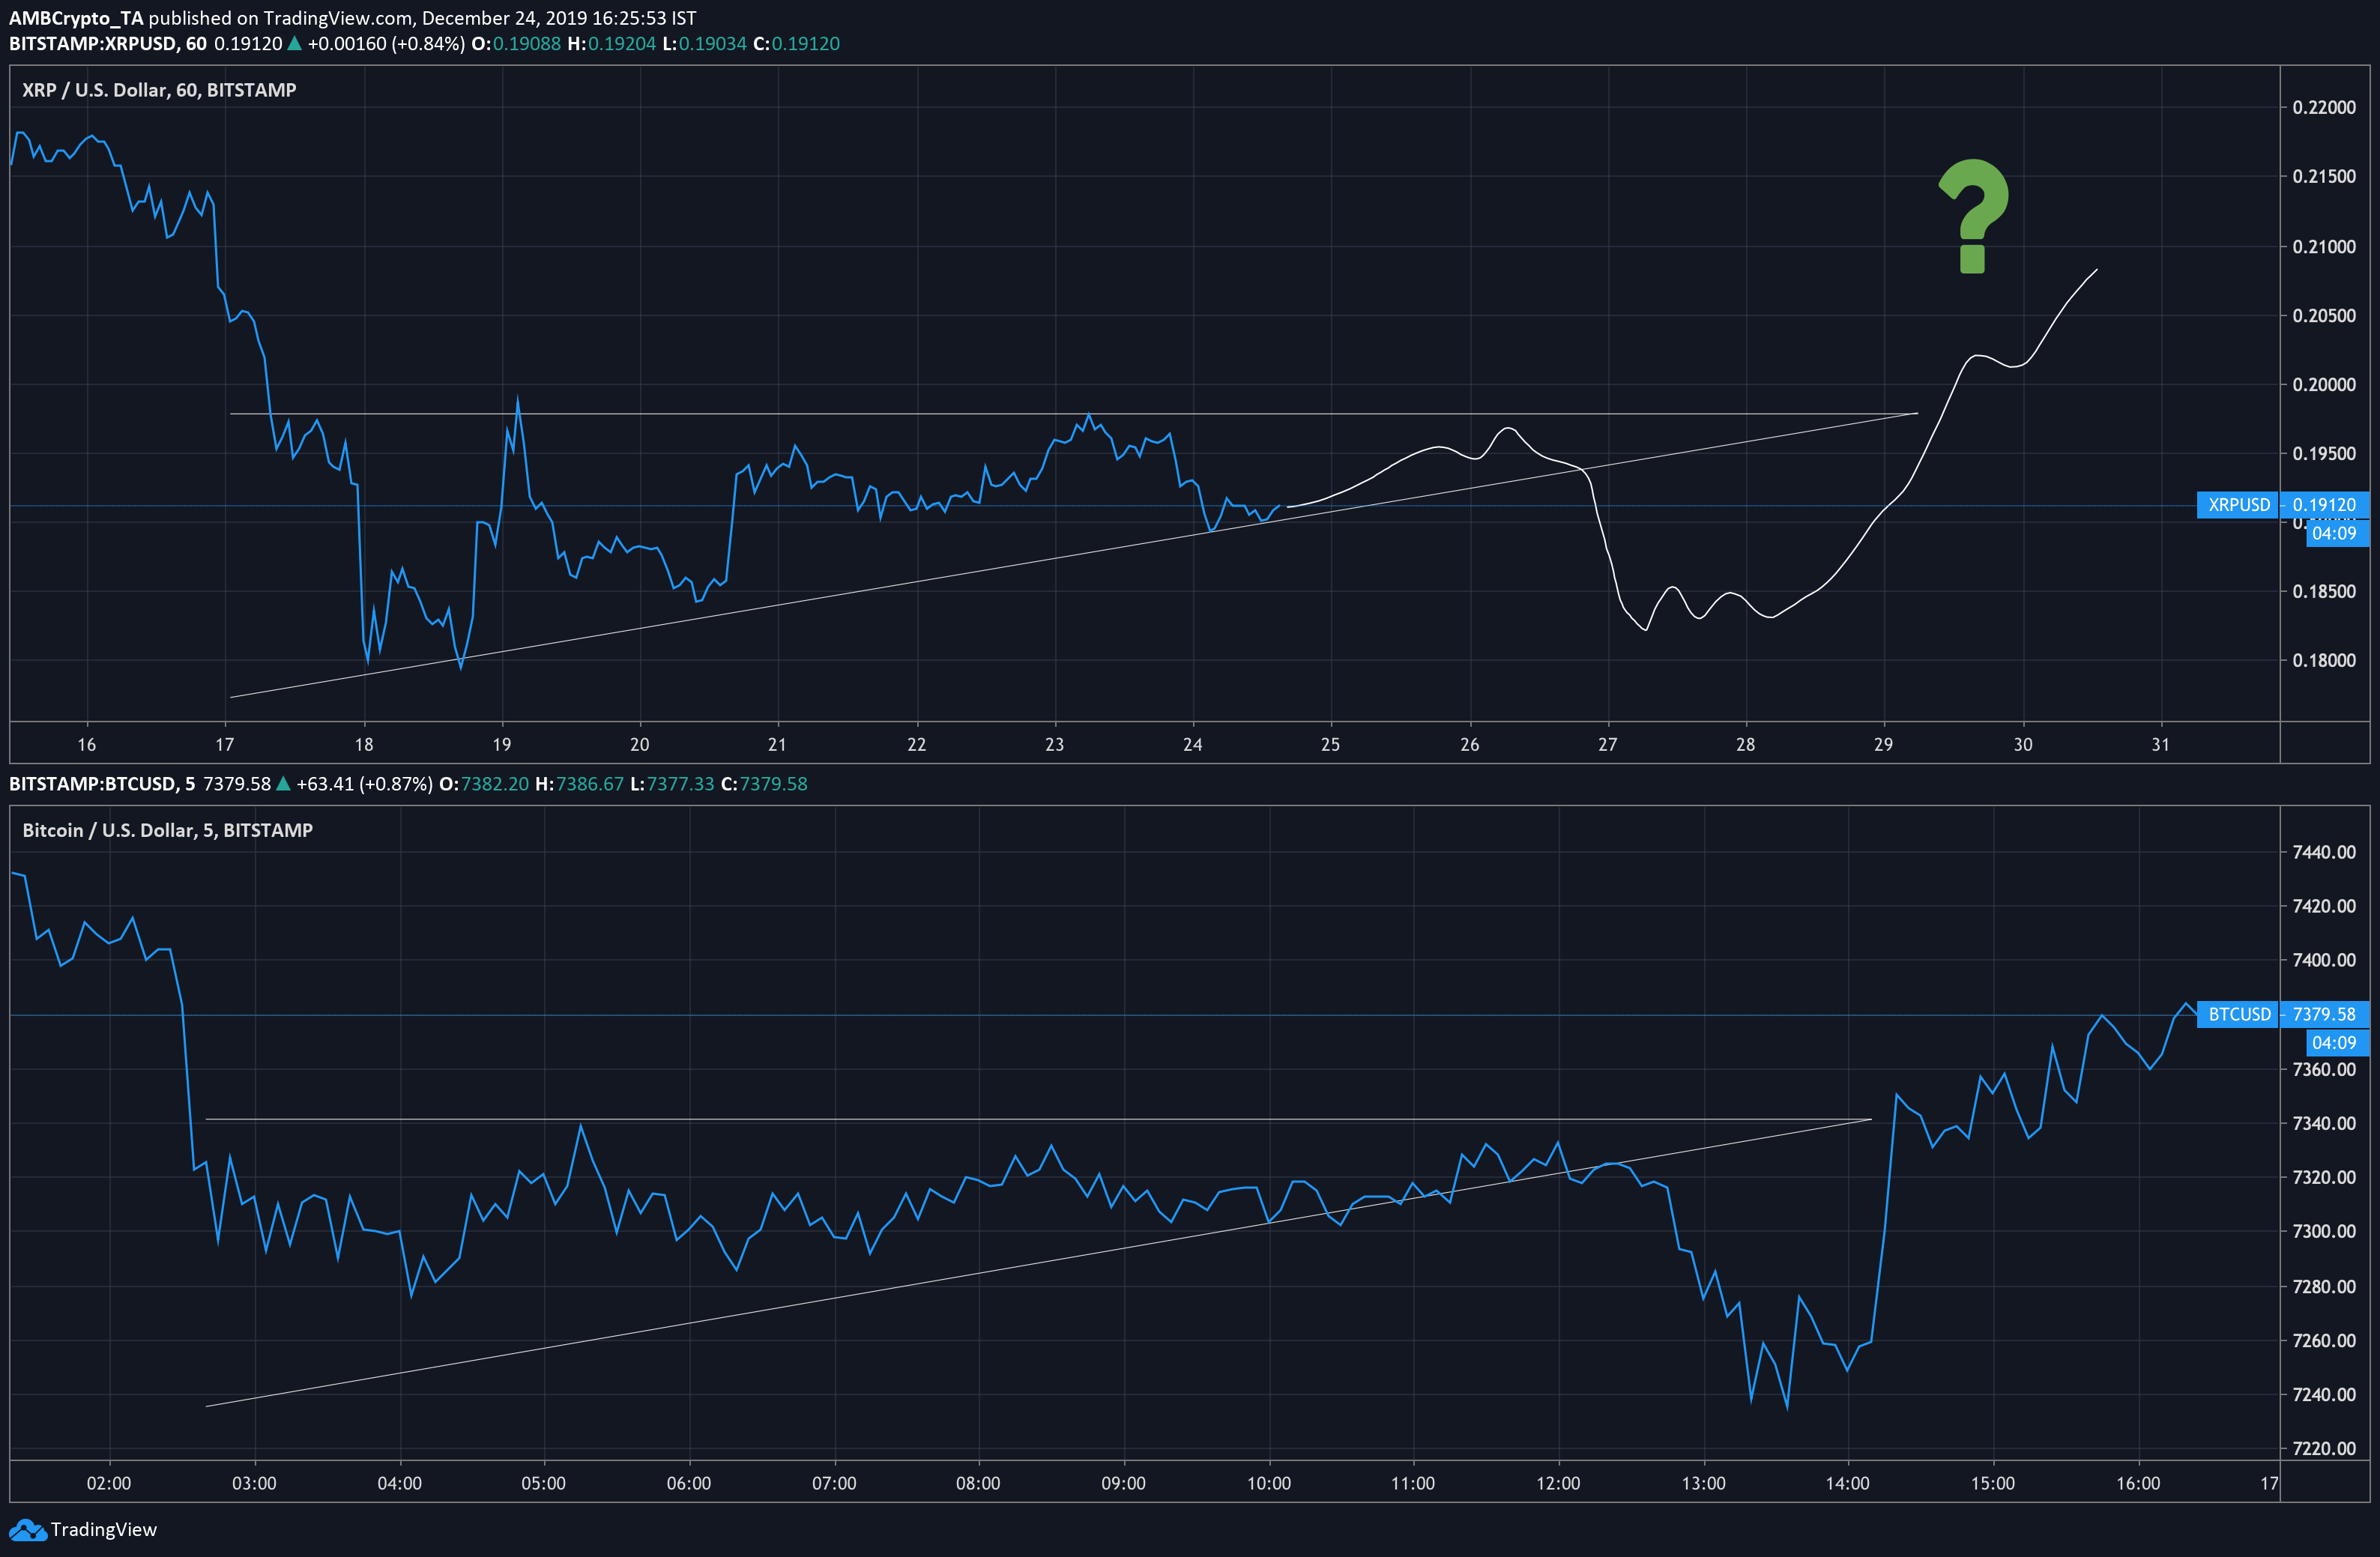
Source: TradingView
XRP 1-hour chart
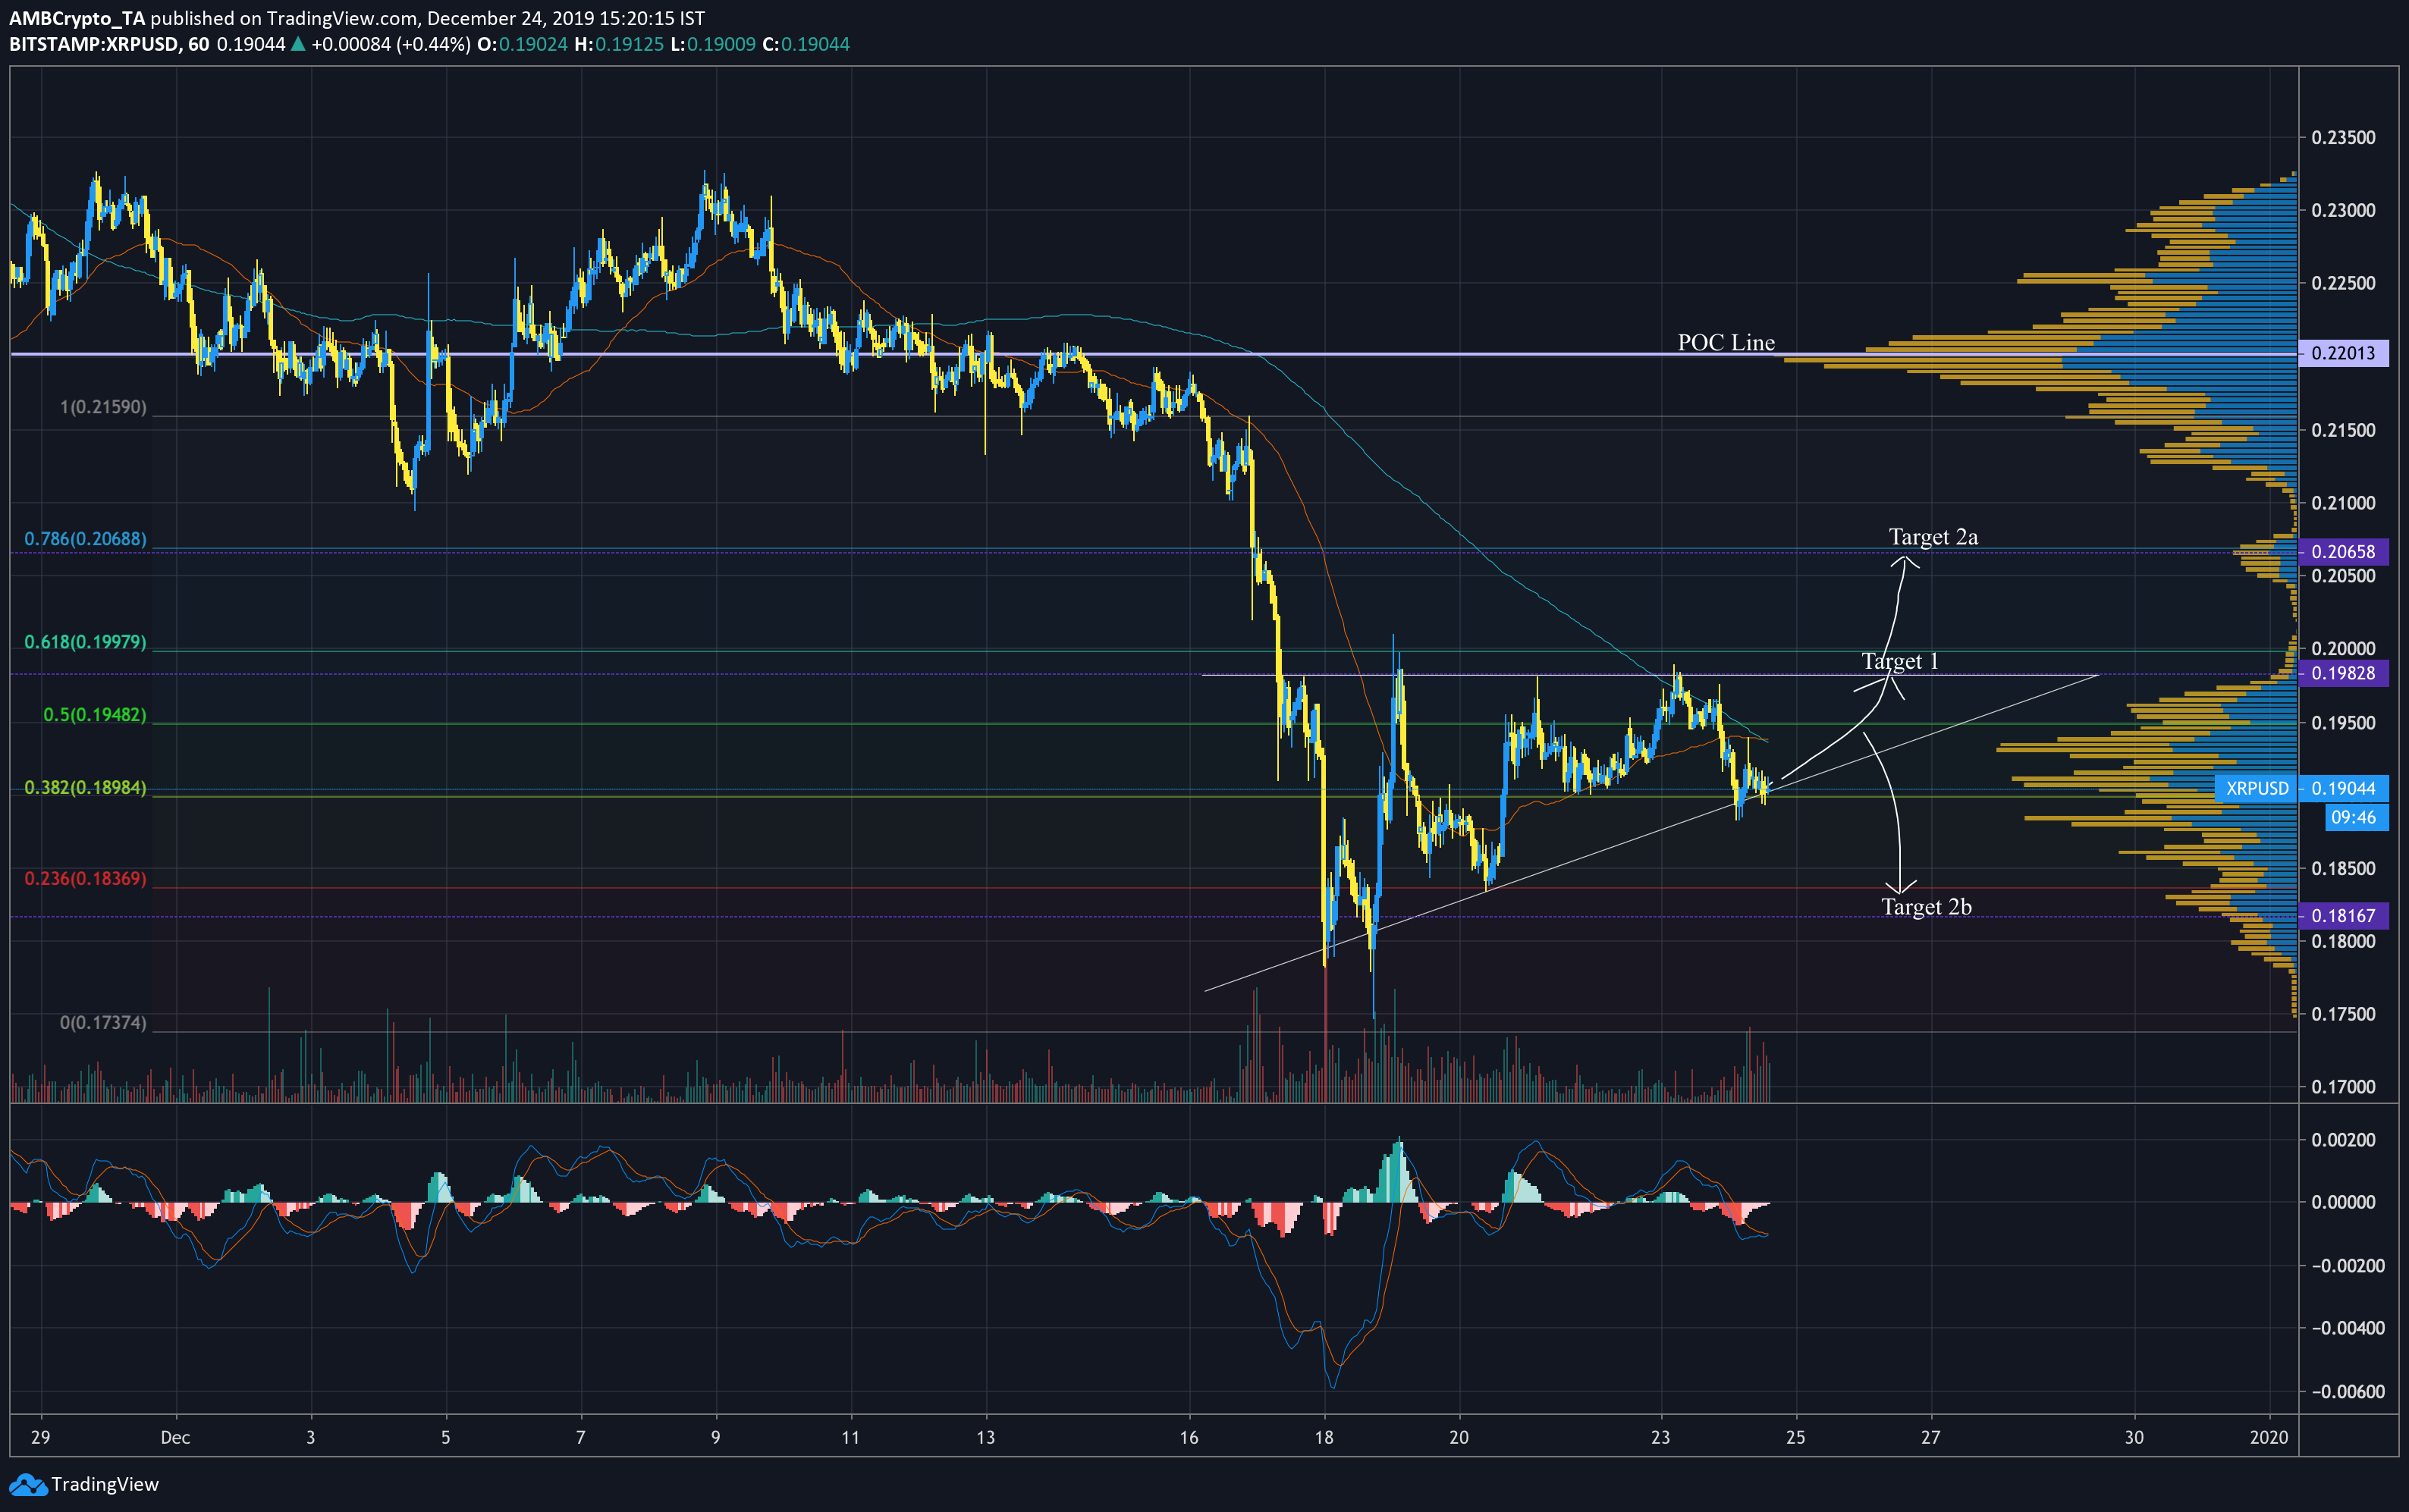
Source: XRPUSD on TradingView
The 1-hour chart showed XRP in an ascending triangle formation around a week ago, testing the 38.2% Fibonacci retracement line at the time of writing. The decreasing volume trend, a key complement of ascending triangle patterns, likely indicated a move upward in the following days, as the volumes look to have risen again in recent hours.
These patterns tend to breakout upward 63% of the time, and as the volume trend looks to be increasing, a price movement to the next volume node on the VPVR seems highly probable. A Christmas-day move to Target 1 at $0.198 seems all but certain in this scenario. Ascending triangles also tend to breakout ~60% of the way to the triangle apex, making an upper pattern trend line breach possible in the afternoon hours of the following day. This could see XRP rise to Target 2a at $0.207, the 78.6% Fibonacci retracement line.
50 and 200-hour moving averages look to be making a bullish crossover, with the two lines just touching above the current price candle. As MACD line is also in position to make a bullish movement above the signal line, it seems far more plausible that XRP will move up in value over the next few days.
However, if the trade volumes decrease, XRP could break down from the 50% retracement line to around $0.181 at Target 2b, though this scenario seems less likely given the information available.
The price movement also arguably looks to be following an ‘inverted Bart pattern’, for which only a bullish breakout would complete the pattern. If the pattern is, indeed, following the inverted Bart, a move up to the POC line ($0.22) doesn’t seem impossible before the end of the year.
Further, the moderate positive correlation with BTC price-action could mean that even if XRP drops under the pattern, it could rebound back up to Target 1 and continue along the predicted path soon after.
Conclusion
XRP will likely move up to Target 1 in the next couple of days and has a high probability of breaking out to $0.206 (Target 2a) before the year comes to a close.