XRP
XRP’s rising tide likely to face hurdle with formation of descending triangle
The year 2019 has been rough for XRP solely because of its price. As the new year set in, XRP’s price consolidated mainly between the price range $0.2604 and $0.3834. After numerous tries, the third-largest coin broke out from the consolidating price range but eventually had to return after 56 days. Since then, the price of the coin has been pulled towards the bottom, with support at $0.2382.
The coin’s ATH peaked at $3.5416 during the end of the bull run in January 2018, after which it nosedived by 82.20% to be valued at $0.6308. The coin has not yet tested this range and has been forming new supports at a lower price range. Even the short-term charts do not bear any good news as bears’ looming presence can be sensed through many short-term charts.
4-hour

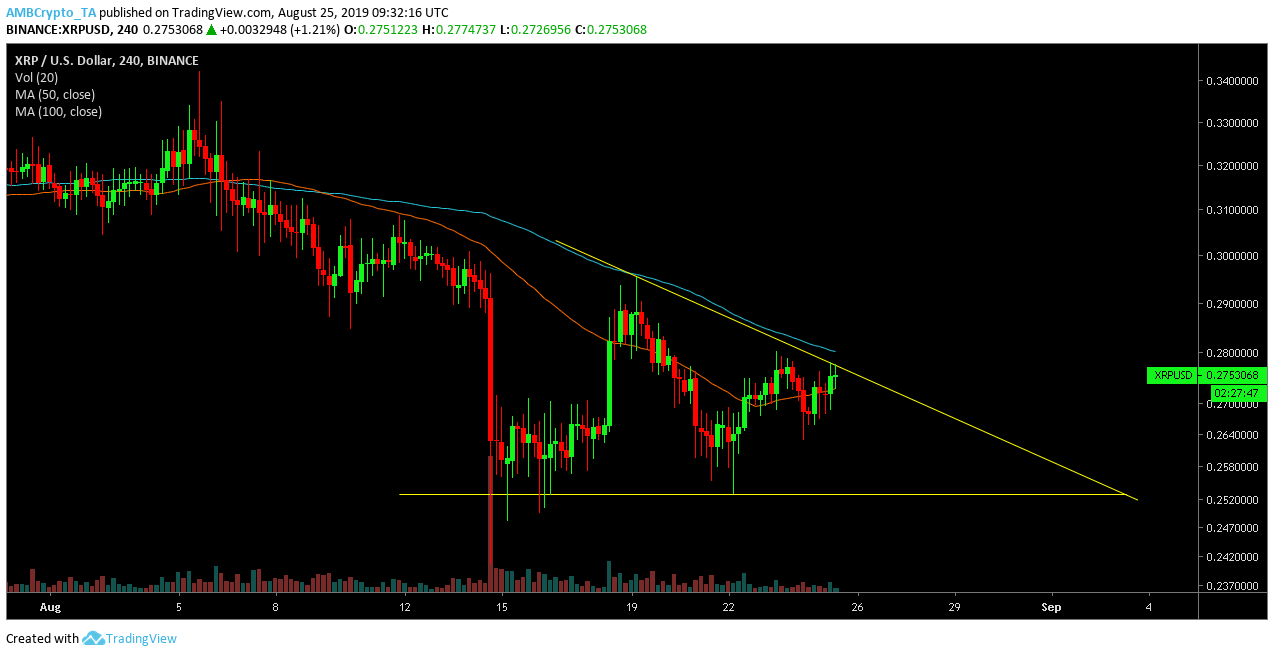
Source: Trading view
The four-hour chart of XRP indicated formation of a descending triangle. Being a bearish pattern, it is characterized by one line that connects a series of lower highs, while the horizontal line connects a series of lows. Price movement is likely to take place within the descending triangle, reaching a point of convergence where the price will breakout downwards. Often a cue to many traders to take short positions, a descending triangle also indicates weakening demand of the coin.
The 50-moving average was surfing under the 100-moving average, affirming bearish takeover. The crossover that took place 15 days ago, has been the most prevalent pattern in the XRP market this year. Even though the MACD line was above the signal line, a trend reversal is imminent as the growth momentum of the coin has been showing signs of decline.
Breaking wave
A momentary XRP rise is all the community is likely to experience before price starts consolidating within the descending triangle. As the wedges close within the triangle, the lower highs and series of lows, signal an imminent downward breakout.


