Analysis
XRP’s rising price may be stopped in its tracks with the breach of symmetrical triangle
XRP’s price noted a significant rise on 30 September, with the coin breaking out of the descending channel. The coin’s price surged by 11.34% over 24 hours, resulting in its value appreciating from $0.2367 to $0.2635. The coin currently stands firm at $0.2547, with a market cap of $11.01 billion.
The short-term chart reflects uncertainty in the market with the formation of a triangle.
1-hour

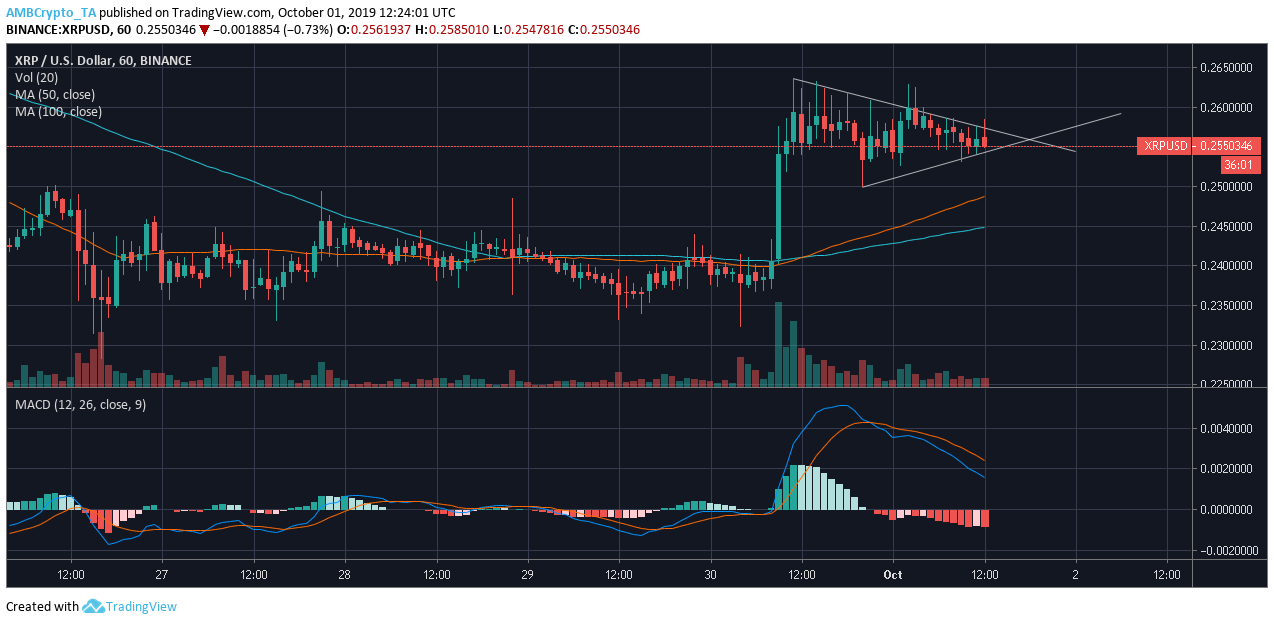
Source: TradingView
The one-hour chart for XRP suggested the formation of a symmetrical triangle, after the price of the coin broke out. The pattern defined by continuous downtrends and uptrends marked sequential peaks at $0.2637, $0.2608, $0.2585, and $0.2575, and sequential troughs at $0.2497, $0.2534, and $0.2542, respectively. The trend lines have been converging and forming a symmetrical triangle. However, due to the price movement, the direction of the breakout is not certain.
The 50 moving average indicated a bullish market as it rested above the 100 moving average. However, the MACD line suggested a bearish market as the MACD line lay under the signal line.
4-hour
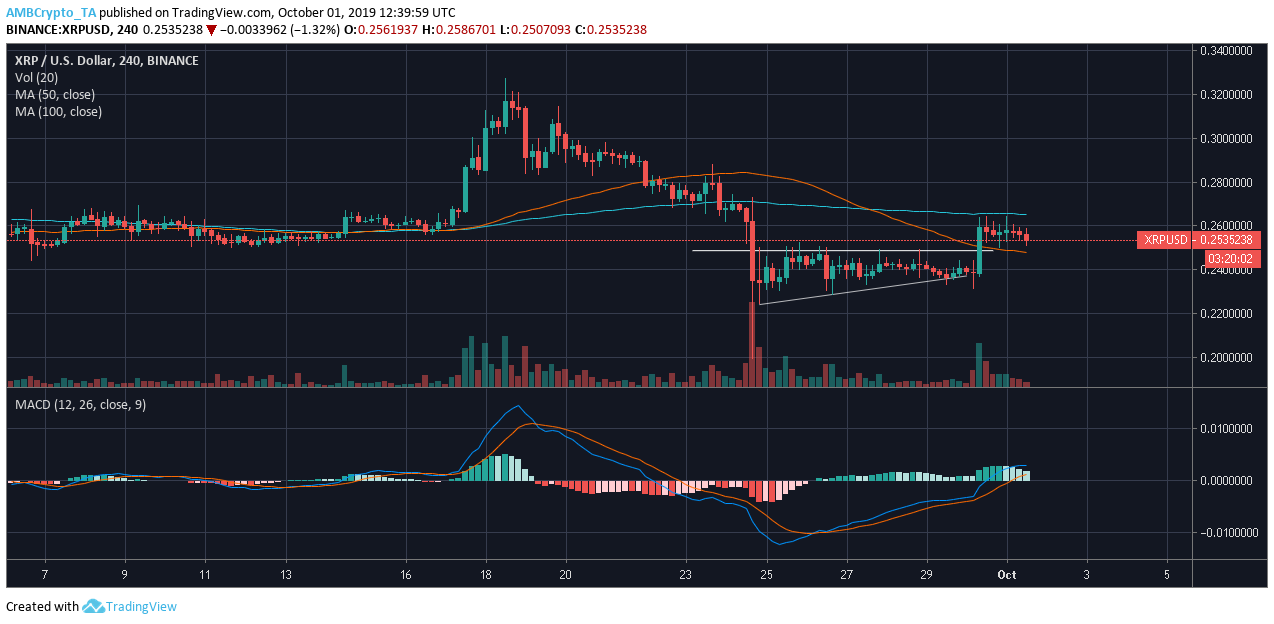
Source: TradingView
XRP’s 4-hour chart reflected the coin breaking out of the ascending triangle pattern. Defined by two trend lines- one which marked the higher lows at $0.2244, $0.2292, and $0.2361, and the second which marked the resistance at $0.2499, the ascending triangle breach offered a boost to XRP’s value. However, the trends appeared to change as the 50 moving average was overtaken by the 100 moving average.
The MACD indicator appeared bullish in the XRP market, as the MACD line rested above the signal line.
Conclusion
The one-hour chart for XRP highlighted the formation of a symmetrical triangle. However, there was hidden divergence between the RSI and the price was observed confirming MACD’s bearish outlook.


