Analysis
XRP’s price may come under attack as coin moves towards breaching descending triangle

The spiraling price of XRP had built up enough potential energy to bounce by a staggering 27% on 19 September. The price of the coin peaked at $0.3292, following which it was on a descent, at press time.
The short-term charts for XRP suggest a continuing fall in the coin’s price.
1-hour

Source: Trading view
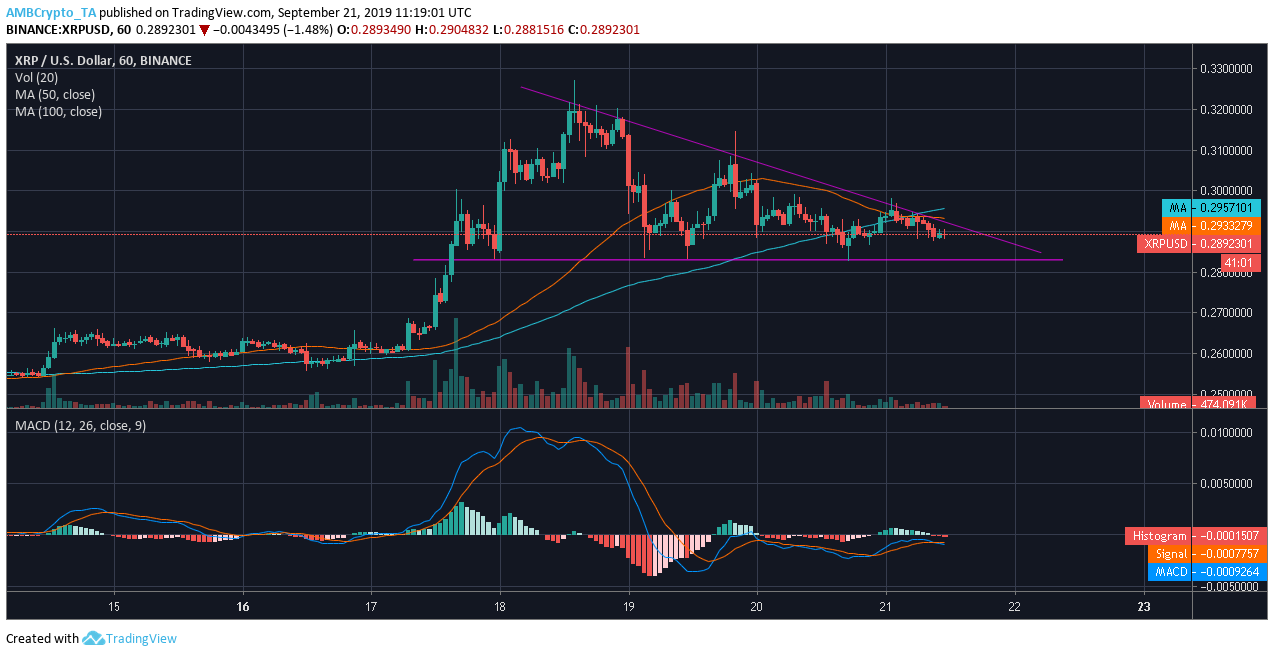
The 1-hour chart for XRP signaled the formation of a bearish descending triangle. The pattern characterized by two trend lines, one sliding across the chart to mark the lower highs at $0.3217, $0.3177, and $0.2951, while the second horizontal line supported the price at $0.2824. The price has been consolidating between the two trend lines and the declining volume complements the forming pattern.
The 50 moving average was under the 100 moving average after a recent crossover. MACD line affirmed the bears creeping into the market as it slipped under the signal line, at press time.
4-hour
Source: Trading view
The 4-hour chart revealed the same descending triangle pattern, connecting the lower highs at $0.3271, $0.2972, and $0.2938, as the base of the triangle was marked at $0.2832. With price moving inside the triangle with reducing volume, a breakdown is imminent for the coin.
Despite the formation of a descending triangle, the 50 moving average had a lead over 100 moving average, suggesting the presence of bulls, but not for long. The Relative Strength Index suggested that the buying and selling pressure in the market had reached an equilibrium.
Conclusion
After enjoying soaring prices for a while, the coin might go back to its comfortable bracket between $0.27 and $0.25.

