Analysis
XRP’s descending channel indicates potential dip of over 8% underway

Following the Head and Shoulder pattern formation that continued from February to March’20, XRP’s price has continued to decline. As the coin remained vulnerable at $0.209, at press time, Bitcoin’s massive drop only added to its woes.
XRP 4-Hour Chart:

Source: XRP/USD on TradingView
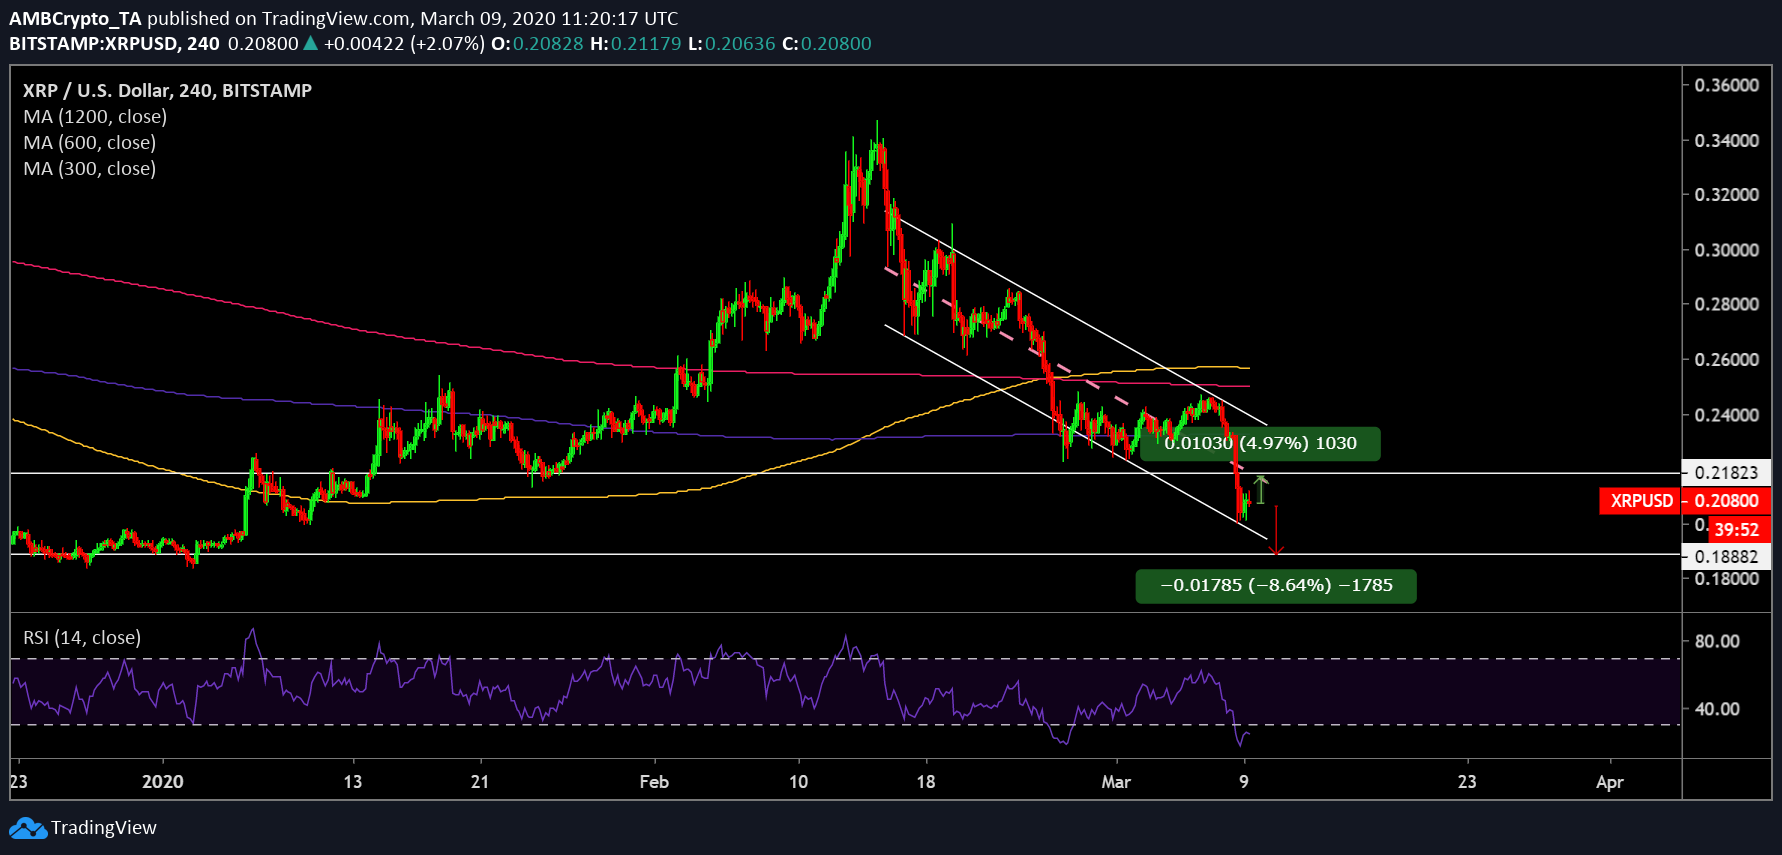
Descending channel pattern took shape in the XRP 4-hour chart with its price oscillating between two down sloping parallel lines. While this seemed to be a bullish depiction, bears could potentially have an upper hand in XRP’s price chart.
The coin found major resistance at point $0.218, as the XRP bulls appeared to have been weighed down by the center-line of the descending channel at the point. All three daily moving averages, 50, 100, and 200 appeared to squeeze the price further down the chart.
Moving averages shifts towards bears
XRP’s price underwent a golden cross in the last week of February. However, lately, bears seemed to have gained control following the massive downward spiral that the cryptocurrency community witnessed on 8th March.
Both the 50-day moving average as well the as 200-day moving average appeared to drop at press time which indicated a negative sentiment in the market. Further validating the bearishness was the 100-day moving average which was well below the crucial 200-day moving average.
RSI indicator was in the oversold region. While it did initiate an upward spring, it failed to maintain the necessary momentum due to the heavy resistance lower band of the indicator.
If downward pressure persists, the coin could potentially fall by 8.64% to hit its support point at $0.188. However, in an unlikely event of XRP bulls managing to gather strength, the coin could go up by 4.97% to its major resistance level at $0.218.
The dip
The latest bearish momentum of the coin could be attributed to the fall of the king coin’s price that drove the entire crypto market to post significant losses.
Cryptocurrencies, such as XRP, have a high correlation with Bitcoin. Hence, these altcoins have historically, closely followed the price movement of Bitcoin and continues to do so. According to the CoinMetrics chart, the correlation coefficient stood at a high of 0.69.
Source: CoinMetrics | Correlation Chart BTC-XRP
Conclusion:
The turmoil in Bitcoin’s price has affected altcoins as well. XRP’s price chart predicted a bearish picture for the coin in the near future, where its price could breach significant support points and trade near December lows.

