Analysis
XRP’s break from ascending triangle pattern is a sign of green pastures
If I got an XRP each time someone asked me about the price, I might have become a successful hodler! Addressing the elephant in the room -the question of XRP’s price swings in short-term; surprisingly the grass is green on this side of the coin as key indicators point towards a trend reversal.
August was tough on XRP, as it registered a devaluation of over 11%. XRP opened at $0.3200 and dipped to $0.2552 within 29 days. XRP breached an ascending channel and fell by 5.42%, following which the price consolidated for a few days. With each passing day, XRP’s short-term chart has appeared to break continuous bearish trends, with the formation of an ascending triangle.
1-hour

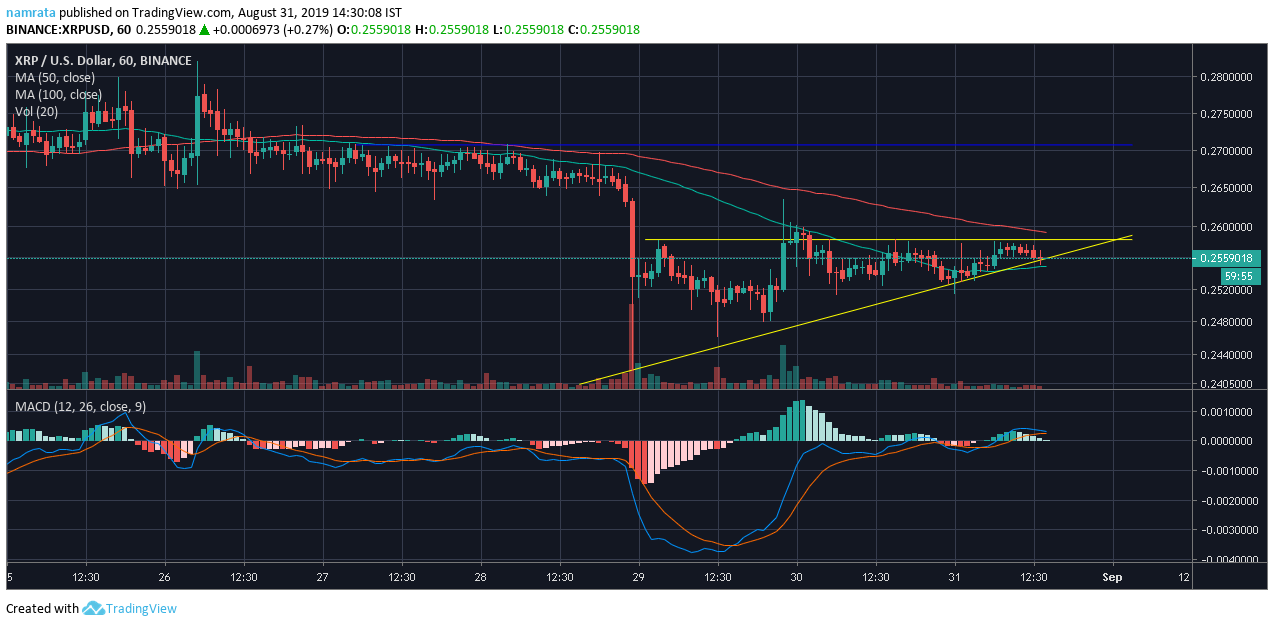
Source: Trading view
Considered a good omen, an ascending triangle signals a bullish trend and is characterized by a horizontal and a rising trend line. In XRP’s case, the horizontal line rests at $0.2580, while the rising trend line registered at $0.2477, $0.2530, and $0.2549, as the price started to consolidated. Nearing consolidation period, an upward breakout is expected, and this is complemented by growing momentum indicated by MACD.
4-hour
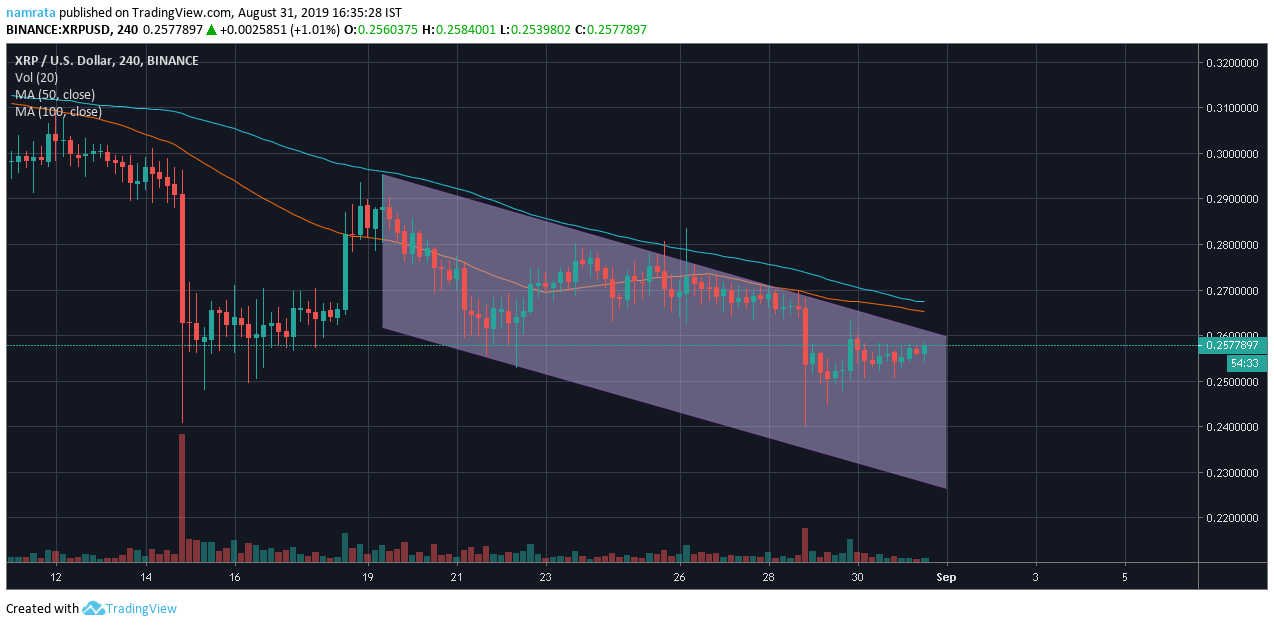
Source: Trading view
Longer-term analysis of XRP foretells a story of greener pastures, as a descending channel extends from $0.2899 and bridged lower highs and lower lows. The price of the contentious coin is bouncing between the channel, and is leaving marks at lower highs and lower lows. An unexpected breach of the descending channel will allow XRP to challenge its immediate resistance at $0.2698.
Bulls at work
The ascending triangle and descending channel, together with the MACD indicator, predict a bullish reign in the short-term, with the price of the coin on its way to breaking above $0.2600 and testing immediate resistance.


