Analysis
XRP short-term Price Analysis: 21 October

XRP hasn’t been able to rally behind Bitcoin over the past week but the altcoin has kept pace in the short-term trend. Currently breaking above immediate resistance at $0.244, XRP is looking to enter an important transition range at the present moment, which may direct the imminent short-term market. XRP is currently valued at $0.249 with a market cap of $11.20 billion.
XRP 1-hour chart

Source: XRP/USD on Trading View
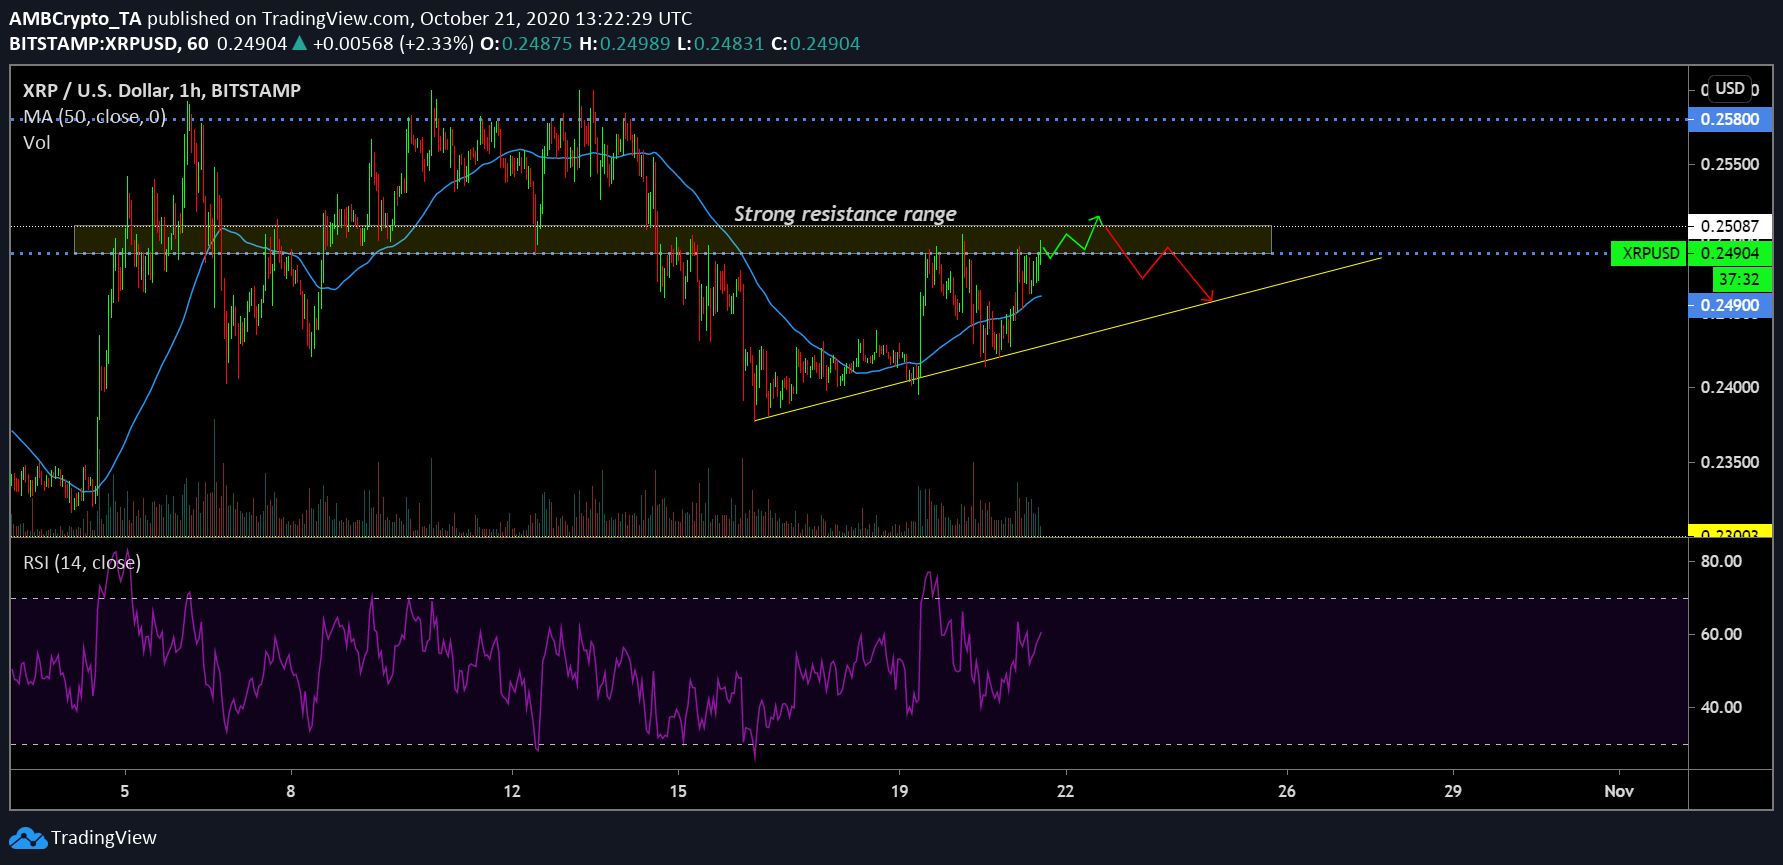
At press time, XRP is currently hovering near the resistance zone (yellow rectangle) evident over the course of October. At the moment, a breach above $0.250 appears a simple move for XRP, considering the trend is slightly tilting towards being bullish but maintaining a position above will be crucial.
While a move above the resistance range will allow XRP to re-test $0.258, failure to break the range might see the asset decline down to $0.244 once again. At the moment, the Relative Strength Index or RSI is siding with higher buying pressure, indicative of growing bullish momentum.
The 50-Moving Average continued to bestow underlying support as well with the candles appearing above the blue indicator.
Source: XRP/USD on Trading View
The 4-hour chart of XRP faced a more stretched-out trend with the price angling towards a mid-term breach from the ascending triangle. While a bullish breakout might allow XRP to re-test resistance at $0.278, the pattern might not follow usual proceedings.
It stems down to the fact that Stochastic RSI is suggestive of a bearish breakout at the moment, which alters the possibility of a strong bullish break. While XRP can collectively rally alongside Bitcoin anytime now, volatility suggested that the markets will be highly turbulent towards quick bouts of spikes and drops.
For XRP, either a push towards $0.258 will unfold over the current week or a decline down to $0.244.

