XRP
XRP short-term Price Analysis: 21 July

Disclaimer: The following article attempts to analyze the emerging trends in the short-term XRP market and its impact on the price.
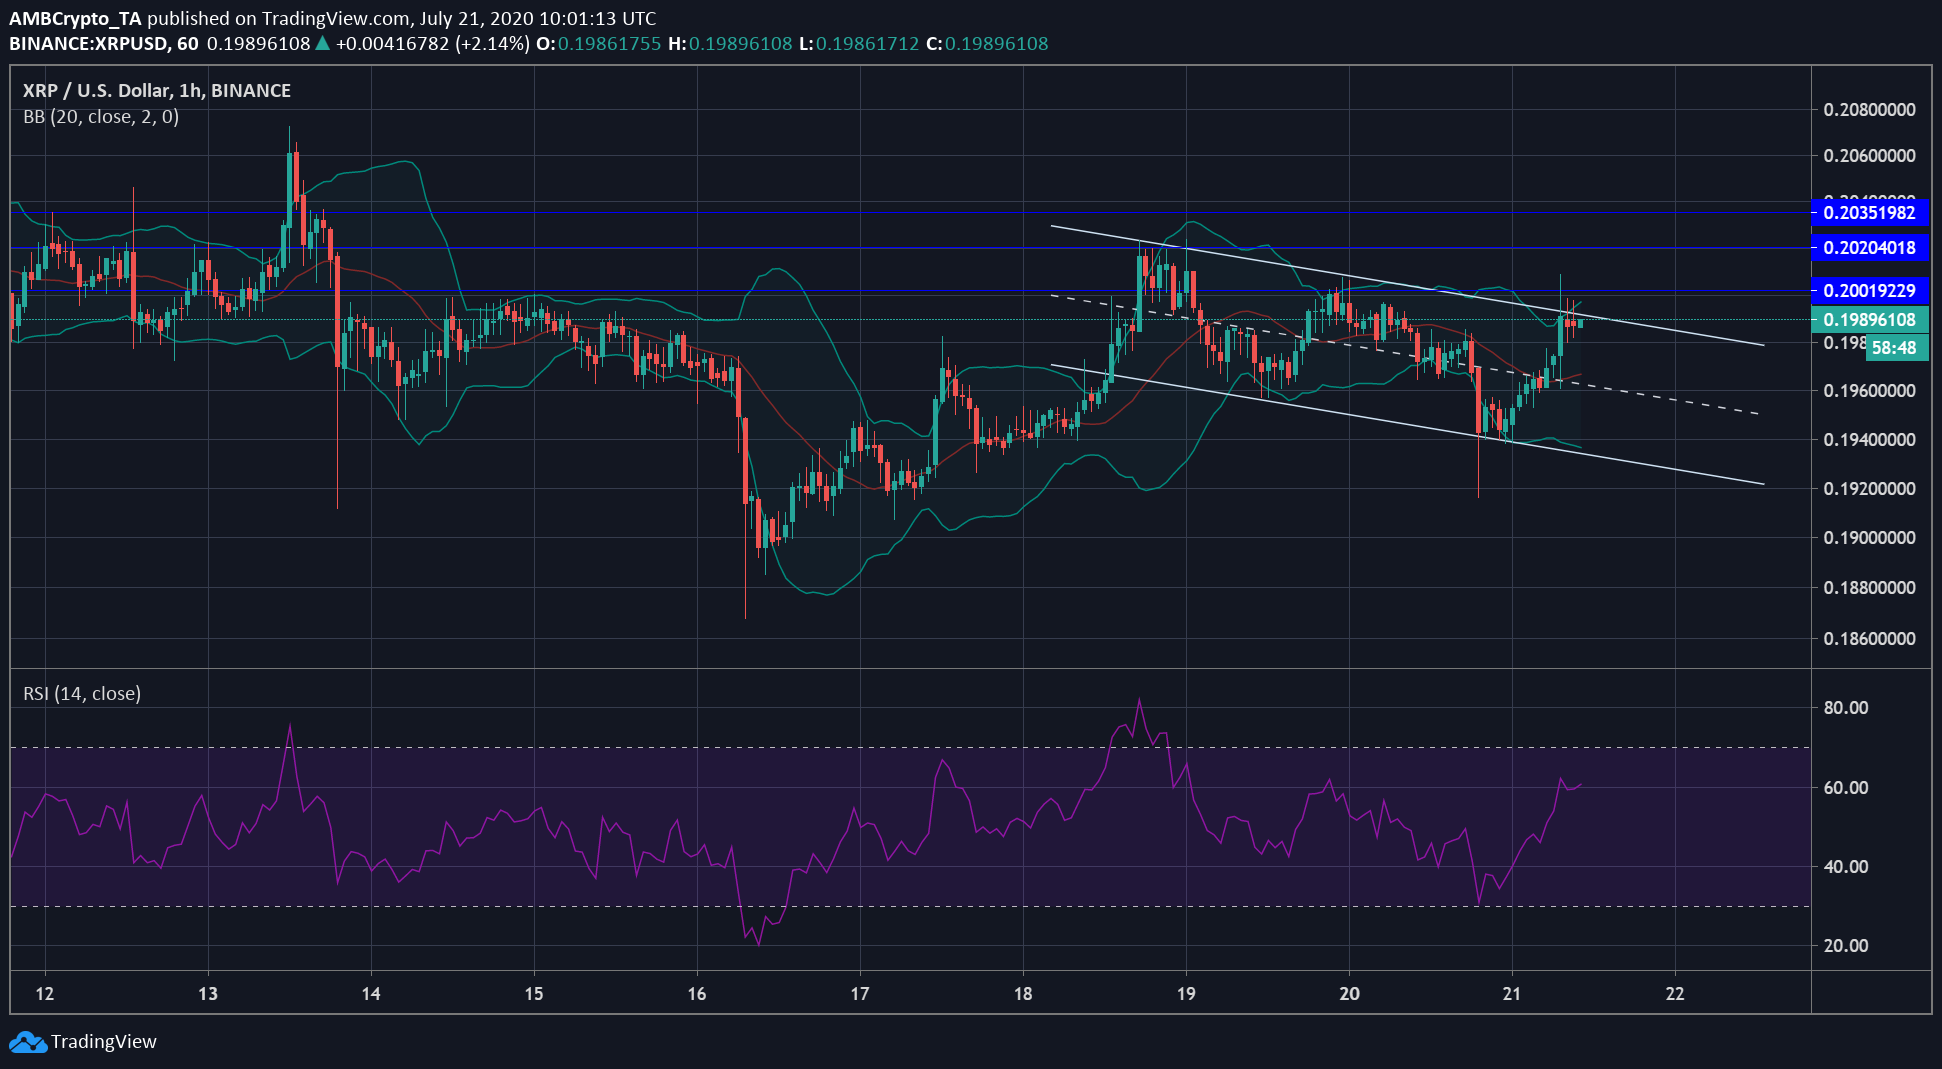
XRP has moved down the CoinMarketCap list to the fourth position, while Tether [USDT] takes its place. This was possible due to a booming USDT ecosystem and a dormant XRP market cap. As the year progressed, the current value of XRP was $0.1990, while it struggles with an immediate resistance at $0.2001. The entry into the $0.2 price level poses many difficult resistances for the coin starting from $0.2001 and followed by $0.2020 and $0.2035. However, the coin has been a part of an uptrend at press time, which may prove beneficial for the future price of XRP.

Source: XRP/USD on TradingView
According to the hourly chart of XRP, over the past couple of days, the price has been moving even lower. This downward-moving price has been creating various support and resistance levels for XRP by connecting the lower highs and lowers lows. According to Bollinger Bands, the current uptrend in price has placed the coin in bullish territory as the signal line remained under the candlesticks. However, since the bands were diverging, it was a sign of volatility stepping up.
As the price rallied higher, the Relative Strength Index [RSI] also moved higher. At press time, the value of RSI was close to 60.47, and if it breaches above 70, it would suggest that XRP was in the overbought zone.
Source: XRP/USD on TradingView
As the price of XRP hovers close to $0.1990, the resistance has been tough at this point. This was highlighted by the Fib retracement tool. The tool suggested that in a short-term chart, XRP’s next support was marked at $0.1962. However, since the breakout from this pattern has been leaning towards a bullish side, XRP may have to breach above the $0.2000, to confirm the breach from the pattern.

