XRP
XRP short-term price analysis: 14 July
Disclaimer: The following article tries to analyze the short-term price patterns of XRP
The cryptocurrency market has been having a tough time in a consolidating phase. However, one major crypto has been stuck at a low level for months now, XRP. The fourth-largest cryptocurrency according to the CoinMarketCap list, XRP has been stuck under $0.30 and only briefly managed to surpass it in February 2020.
At press time, the coin was being traded at $0.1987 with a market cap of $8.77 billion. It has been noting a 24-hour volume fo $1.26 billion, but falling by 2.5% in an hour.
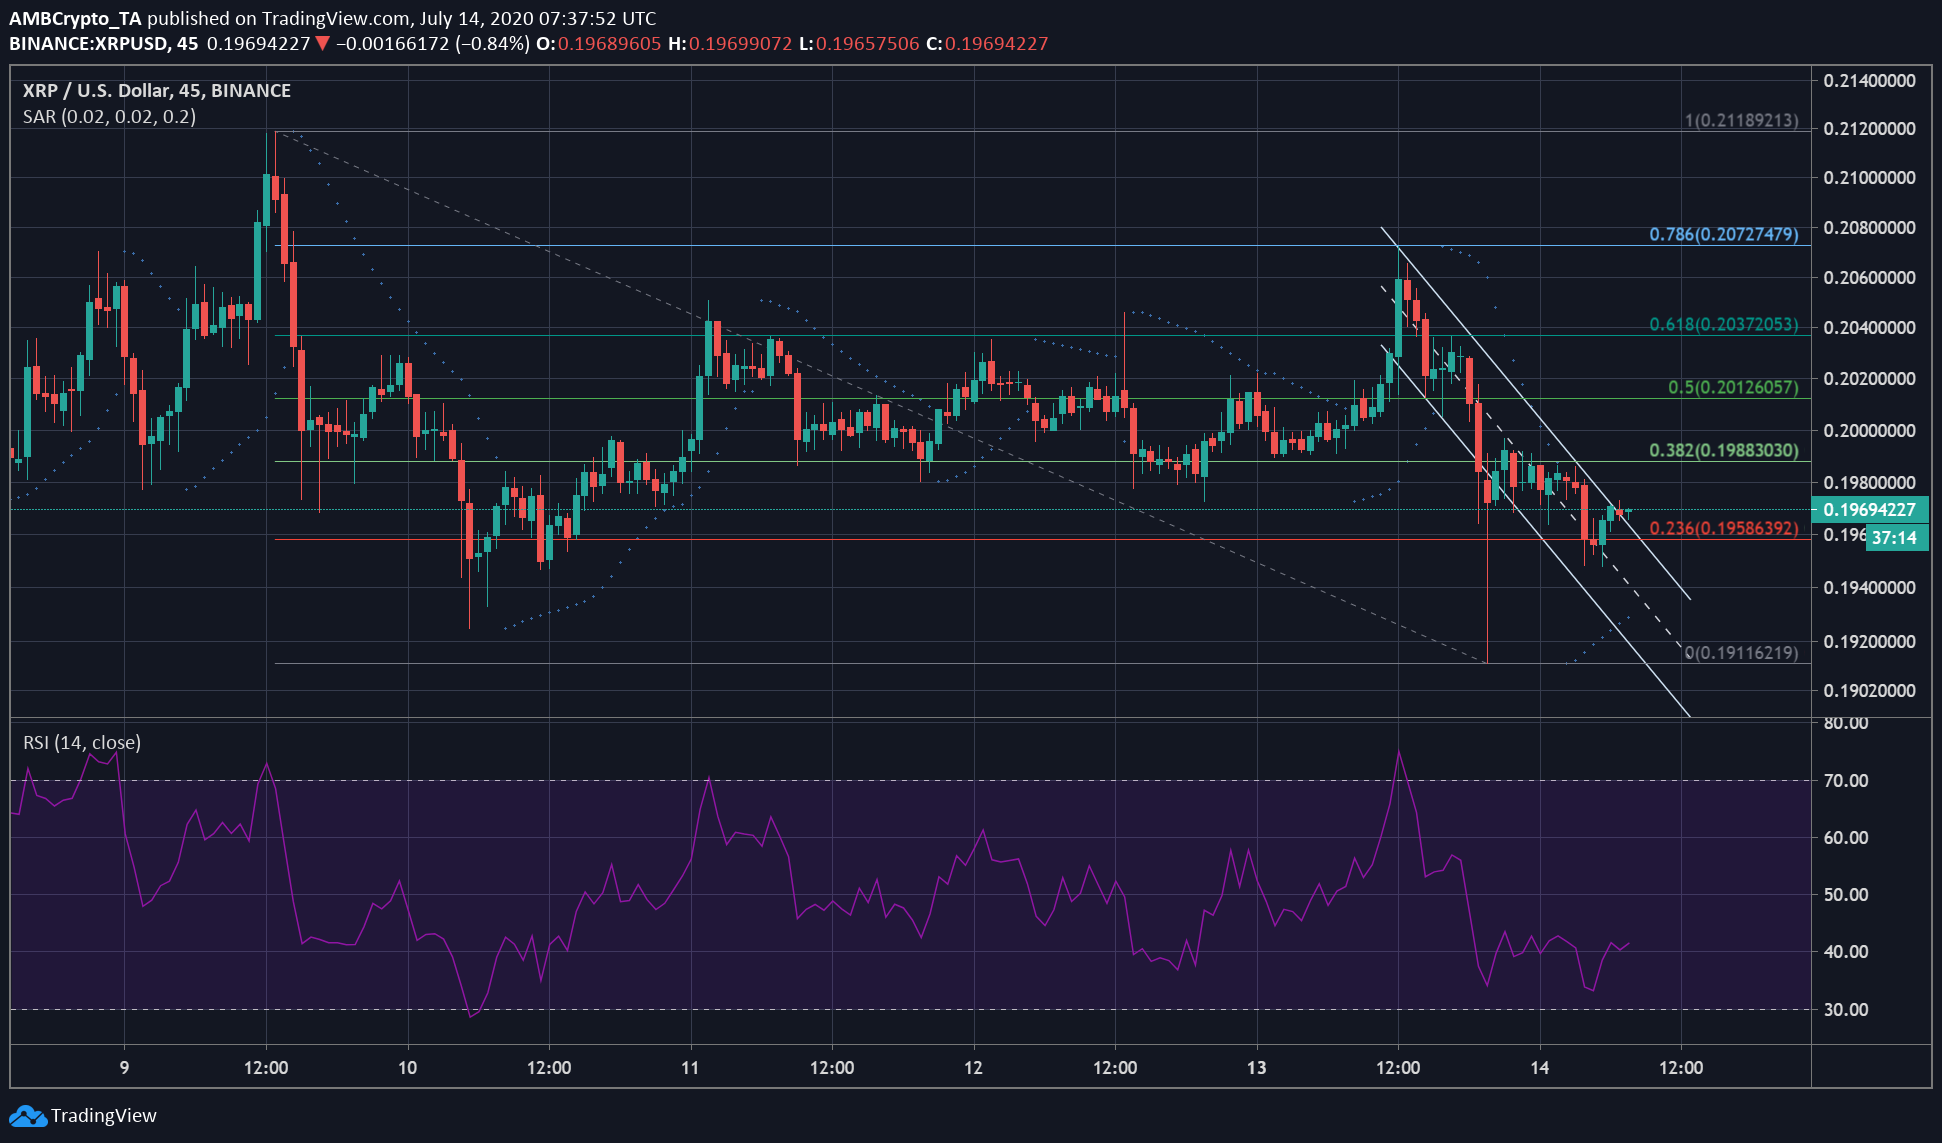
Source: XRP/USD on TradingView
According to the XRPUSD chart, the coin has been witnessing a downtrend in price, forming a part of a descending channel. The markers have aligned above the candlesticks indicating this downward pressure of the price, however as the price moved further along the descending channel, a reversing trend could be expected.
The channel formed by connecting the lower highs of XRP along with its lower lows, marking the optimal support and resistance level for the coin. The Fib retracement marked the levels of support breached by XRP’s price, and as it hovered close to the $0.1958 level, there is the possibility that it might bounce back as it has been a pivotal support. If the coin fails to hold on to this price the next support lies as low as $0.1911.
However, an upwards move also has an immediate, strong resistance marked at $0.1988. The price point has previously acted as strong support for the coin, and now is a resistance it will have to try to breach. Nevertheless, the current price was favored to maintain the equilibrium in the XRP market.
The Relative Strength Index noted that the coin was evening out the buying and the selling pressure after recently, returning from being in the overbought zone.


