XRP, the third-largest cryptocurrency by market cap, has had quite a forgetful year. On one hand, other altcoins, despite not making any stellar progress, did manage several bullish price movements from time to time in 2019. On the other hand, XRP has failed to breach the psychological barrier of $0.30. At press time, XRP was trading at $0.270, having experienced a minimal fall of 0.20% over the last 24 hours.
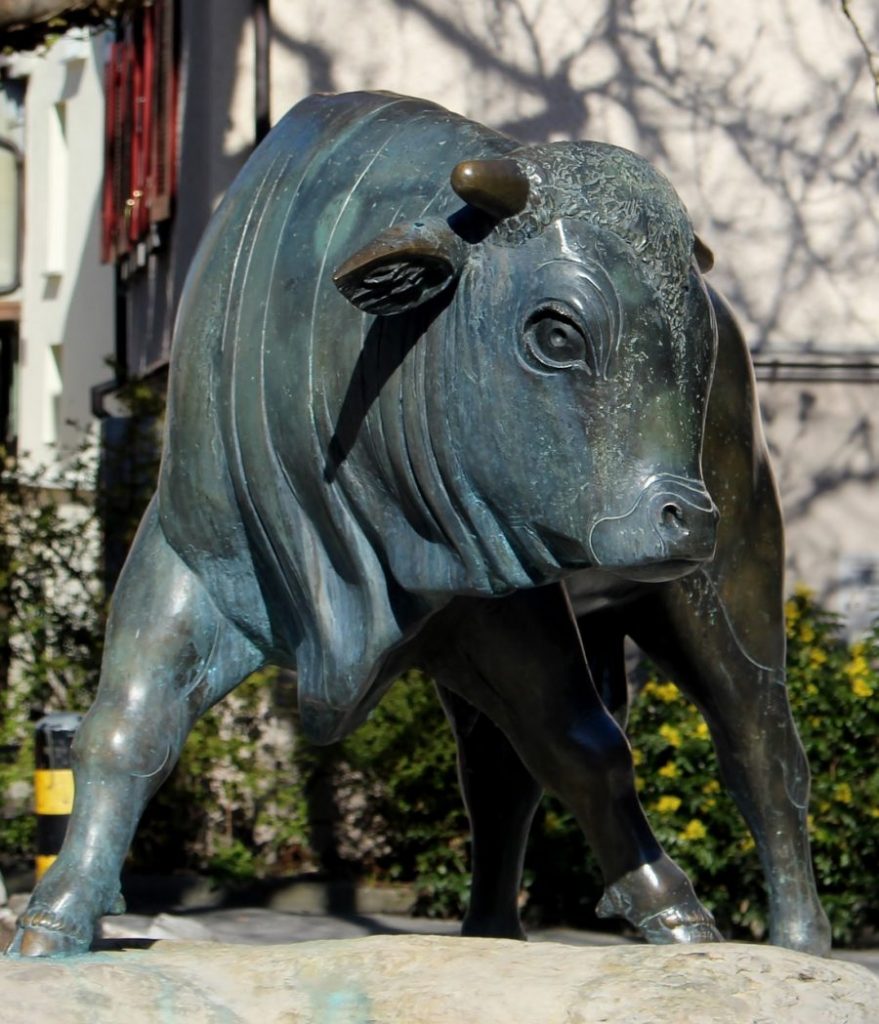
1-Hour Price Chart
Source: XRP/USD on TradingView
XRP was forming a descending channel on the 1-hour price chart, which was characterized by lower highs meeting the channel at $0.285, $0.2726 and $0.2702. The lower lows were touching the descending channel at $0.2766, $0.2661 and $0.2650. The formation of the descending channel is considered to be bullish, as it is usually followed by a bullish breakout.
The RSI also indicated that the buying sentiment had started to take an upper hand in the market as the indicator line began to rise towards the median line. Thus, XRP looked set for a bullish breakout in the short-term.
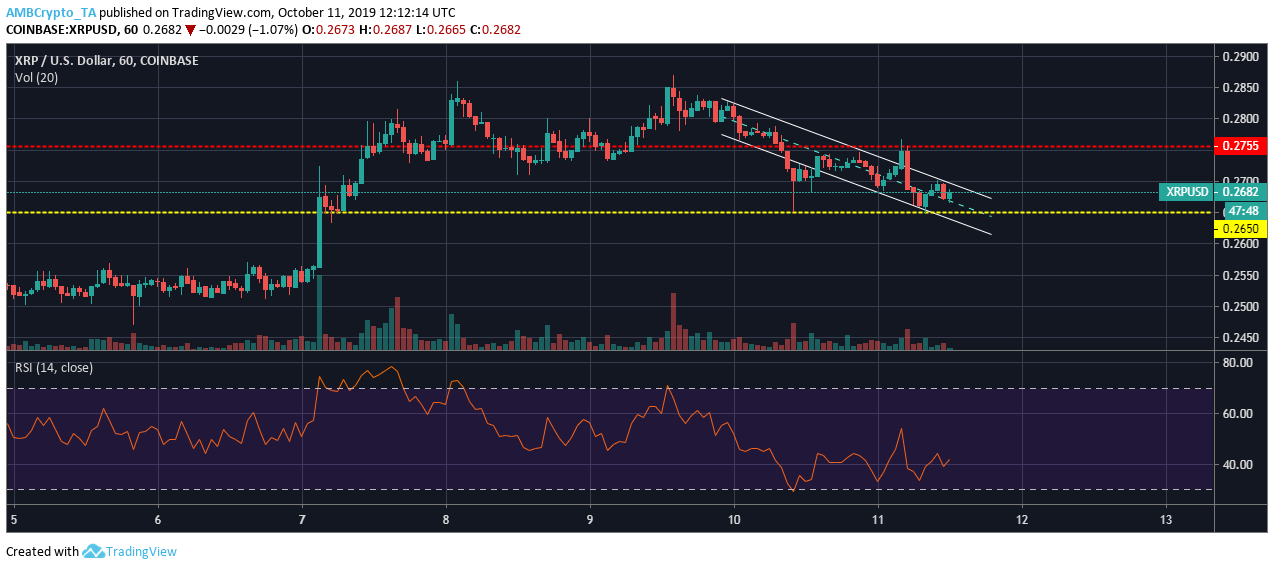
4-Hours Price Chart
Source: XRP/USD on TradingView
On the 4-hour price chart, XRP formed a descending wedge, one characterized by lower highs touching the falling wedge at $0.2867, $0.2823, and $0.2697, whereas the lower lows were meeting at $0.2727, $0.2680, and $0.2646. A falling wedge pattern formation is usually followed by a bullish breakout, which suggested that XRP might see its prices in the green in the short-term over the next 10-12 hours.
The RSI indicator had also broken into bullish movement as it was hovering around the median line as buyers were trying to gain an upper hand in the market. If XRP manages to breach the falling wedge pattern, buying pressure might get more significant.
Conclusion
XRP looked bullish in the short-term as it formed a descending channel on the 1-hour price chart and a falling wedge on the 4-hour price chart. Both patterns are considered bullish and the RSI indicator supported the claims as it showed that buyers were in a position to have an upper hand in the next few hours.