Analysis
XRP exhibits another descending triangle as valuation nears 20-month long price bottom

The last 24 hours have been relatively positive for XRP’s valuation as the third-largest digital asset witnessed a 4 percent hike in 24 hours. The price breached short-term resistance at $0.255 after the valuation consolidated below the mark for the past 5 days.
Bullish momentum was evident in 1-hour chart as the price avoided major corrections after the breakout. However, XRP’s future may not echo the same bullish sentiment, as long-term charts projected a different picture for the asset.
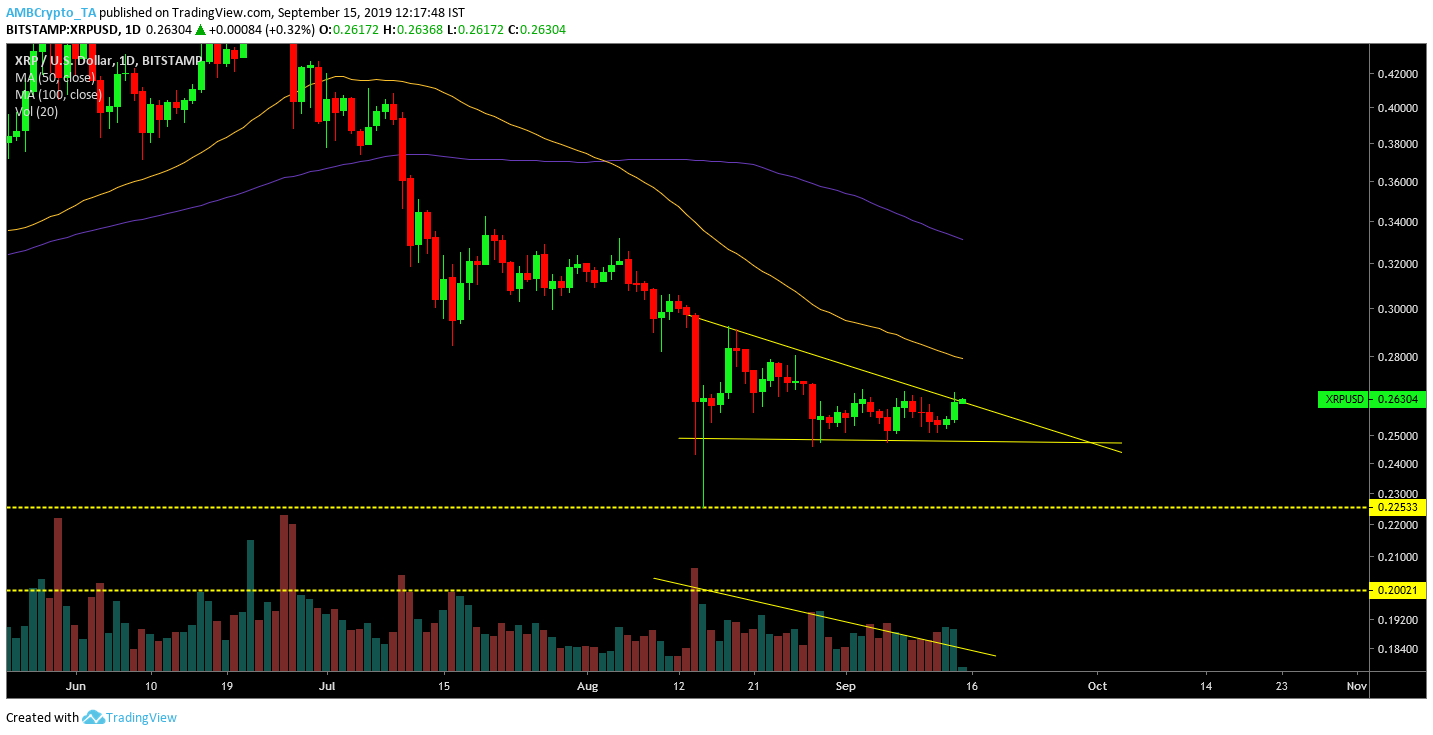
XRP 1-day chart

Source: Trading View
Since June-end, XRP’s price movement has been relatively bearish as valuation slowly declined. Short-term surge should have been instrumental in getting XRP out of the bear market but it failed to do so. The formation of a descending triangle conveyed a further indication that another slump may surface for XRP. The decreasing trade volume confirmed validity of the triangle pattern formation.
Another indicator ringing concerns were moving averages. On 4th August, the 100-moving average completed a bearish crossover with 50-day moving average; this trend has not changed in the past 43 days.
XRP 12-hour chart
Source: Trading View
The 12-hour chart indicated a similar descending triangle pattern for XRP. At press time, XRP’s price was ranging near its yearly-low valuation. The last time XRP’s price treaded in this range was back in 4th December 2017, recording a 20-month price bottom. At press time, XRP was closer to the bottom price than its peak valuation, hence a major drop may not surface for the token.
Fibonacci retracement lines indicated there was strong immediate support for XRP at $0.256 [short-term resistance breached 24-hours ago] and at $0.248.
If the imminent breakout carried strong bearish momentum, likelihood of testing support at $0.239 would increase in the charts.
Conclusion
XRP’s price faces another bearish onslaught in the future but the valuation was very close to its bottom. The bullish breakout should permeate after the bears loosen their grip. However, the formation of descending triangle on both the long-term charts suggested the trend was unlikely to change in the near future.

