
Prior to August, 2019, XRP had only touched as low as the $0.25 mark in September last year. Since August, however, XRP has been unable to cross above the $0.32 mark, trending mostly between $0.26 and $0.29. Currently valued at $0.263, XRP is near the lower end of its recent trend range, and looks to be poised for a move further downward.
XRP 1-day chart
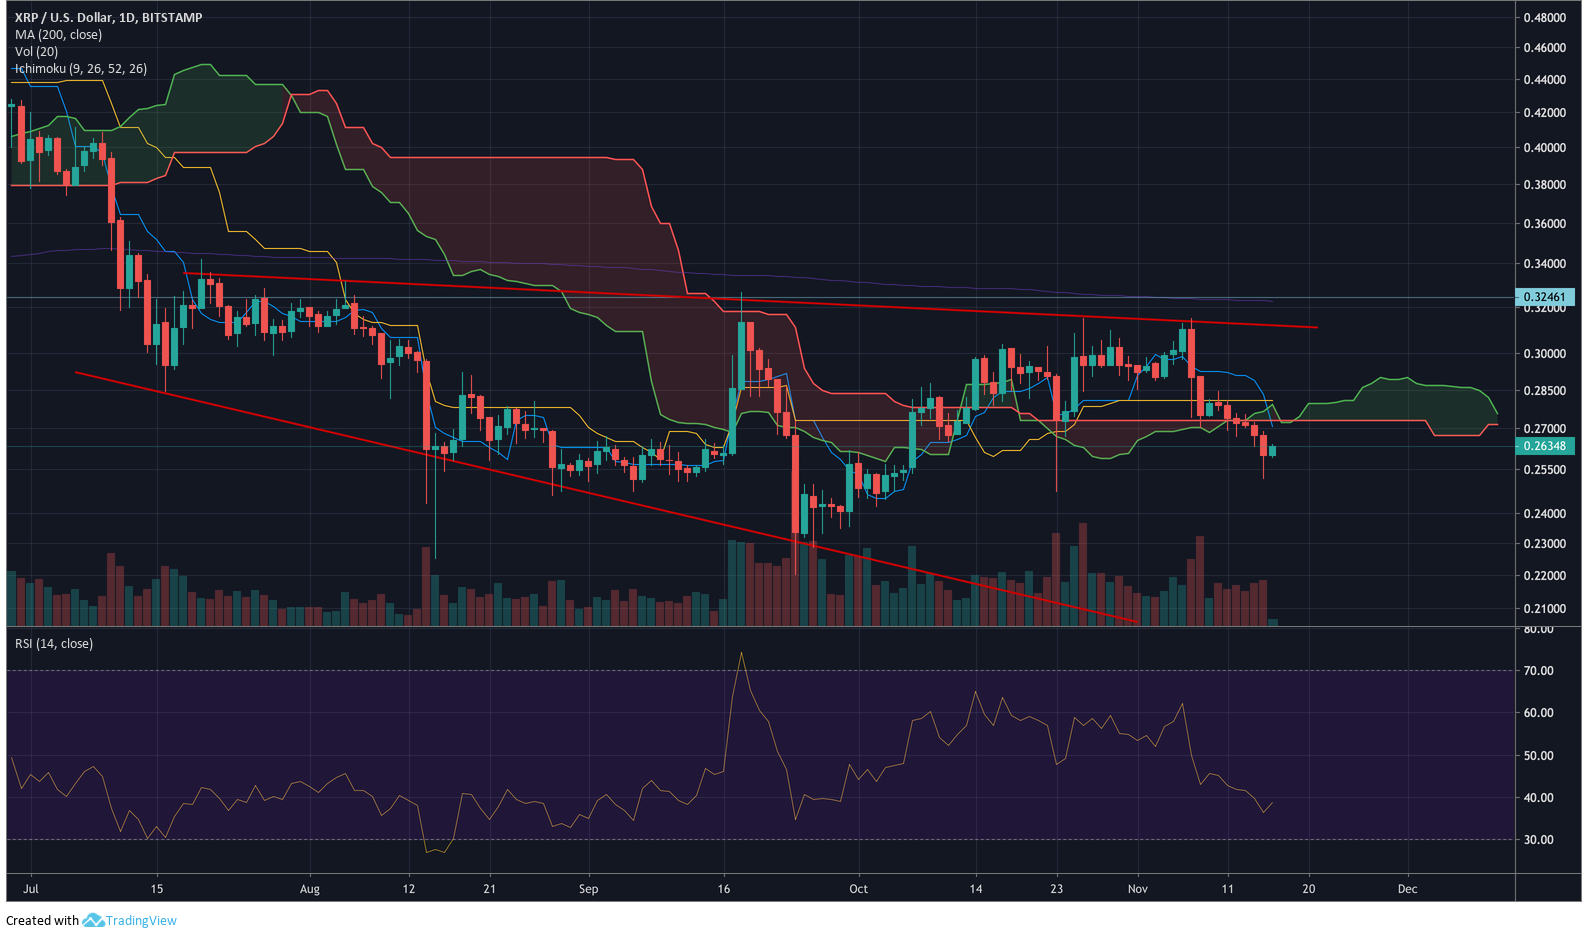
Source: XRP/USD on TradingView
Before we move into predicting XRP’s long-term price movement, let’s make sense of this chart. XRP entered a descending broadening wedge pattern in mid-July, with trade volumes over the period following an increasing trend, which is mostly the case when price movements follow this pattern. Descending broadening wedges tend to break-out in the same direction in which the price entered 58% of the time. Since XRP entered through a bearish movement, there is a higher probability that it will exit through a downward breakout.
The 200-day moving average, which can be seen in light purple, is generally known to be a strong indicator of long-term price movements. Since it can be seen moving above the current price, it could be applying bearish pressure on the price of XRP — another sign that the price will go down.
While RSI is not very reliable in predicting price movements, it can be useful to keep in mind. In the above chart, the RSI indicator can be seen closer to the oversold region, though it looks to be making a move upward, near the 40 mark.
Ichimoku Clouds are a collection of technical indicators which take multiple averages and plot them on the chart. This includes a baseline (yellow), conversion line (blue), and leading spans A (green) and B (rose). The movements of the leading spans create areas between them called ‘clouds’, which can be used to predict how the price is likely to move. When the price moves below the clouds, as seen in the above chart, it is likely the price will move downward. Further, the conversion line crossing under the baseline is usually seen as a signal to sell.
This combination of the Ichimoku cloud looming over the price and the conversion line moving below the baseline is a strong signal for a downward movement in price. With a potential price target of a devastating $0.14, XRP could see a major bearish movement before the end of the year.