
When should you buy Bitcoin? The default answer to that should be every day, irrespective of the price, as the simple dollar-cost average (DCA) strategy goes. But, lets be honest, nobody really does that? Why? Because its too simple. Instead, people look at a host of different technical, on-chain and macro-economic indicators. Bitcoin, due to its nascency and abnormal metrics, does not move according to these indicators, so what can people look at? Let’s start with its price.
Price is a simple thing – it’s a number, easily measurable, scalable, and comparable, everyone understands it, and hence it’s a default standard.
Next, we’ll look at price changes. Again, to keep it simple, we’ll look at price changes over a range of periods, in order to best understand no only when you should buy Bitcoin, but how often will you, what will your average purchase price be, and how this will change over time.
Into the weeds
To reiterate, we’re looking at when is the right time to buy Bitcoin, based on two things, absolute and relative price. A measure of price changes over a period of time is found in moving averages, broken up by periods, we’ll look at the same.
Allowing a wide variety of price changes, and hence variance of buys, we’ll look at six 5 different periodic price changes:
- 200 day moving average (200DMA)
- 150 day moving average (150DMA)
- 100 day moving average (100DMA)
- 50 day moving average (50DMA)
- 7 day moving average (7DMA)
From the high of a 200 day moving average giving the average price of a 6 month period and the low of a 7-day moving average, giving the average price of the past week, we can identify what’s a good relative price indicator to look at, and comparing the same to the absolute daily price of Bitcoin.
So, now that we have our motive (to determine when we should buy Bitcoin), and our indicator (the aforementioned MAs), lets spread this against the daily price of Bitcoin, to check how it compares across a period and whether we can pull out entry and exit signals. But before we get into the period-wise breakdown, let’s define the rules of the game.
Rules of the game
Broadly, since only one MA will guide your buying decisions, it will work like this. When the respective MA considered is above (or greater than) the daily trading price of Bitcoin, you don’t buy. When the respective MA considered is below (or lesser than) the daily trading price of Bitcoin, you buy. So, you just have one signal, the respective MA, to do one of two things, either buy or don’t buy. This will be the crux of the approach. Now, let’s define a few rules.
- Date range: The date range considered is the daily average price between January 1 to October 30
- Buy only: Like with the dollar-cost averaging approach, the aim of this MA-only strategy is to lay out a buy-only strategy, with no indication of when to sell
- Entry and Exit: The MA will serve as a signal to enter or exit the DCA strategy. Here, enter means buying Bitcoin at the daily trading price, and exit means not buying Bitcoin irrespective of the daily trading price.
- MA only: The only indicator we’ll look at is the MA, with no other on-chain, technical, relative-macroeconomic indicators or pieces of news acknowledged. Think of this as a noise vacuum.
- Daily average: The prices considered are the average of the OHLC prices of Bitcoin. For context, the March 12 drop to $3,800 would be averaged out to $5,050, because of the recovery by the close of the trading day
- Bitcoin only: For this experiment only Bitcoin buys will be looked at. Altcoins like ETH or LINK which have seen a rally this past year will be ignored
- Just pause: Since this is a zero-sum strategy, meaning you either do something (buy) or don’t do something (don’t buy), for a large part of the period, you’ll be sitting tight and doing nothing but waiting for a signal. Think of this as simply pressing the pause button on your DCA approach (not the sell button)
- Premium: Since we’re relying on an established trend, there is no ‘Buy the dip’ because the dip is still below the respective DMA. Hence, each buy is at a premium because it has established itself to a sufficient degree by rising consistently above its moving average.
The numbers upfront
Bitcoin began the year at $7,200, dropped to a low of $5,000, in March, and is now at its yearly high of around $13,500. Since this is a look at daily moving averages, the averages change on a daily basis. However, the larger the period i.e. 200, 150, the more stable the average, than the smaller the period i.e. 7, 50.
A look at the price chart of Bitcoin against the MAs:
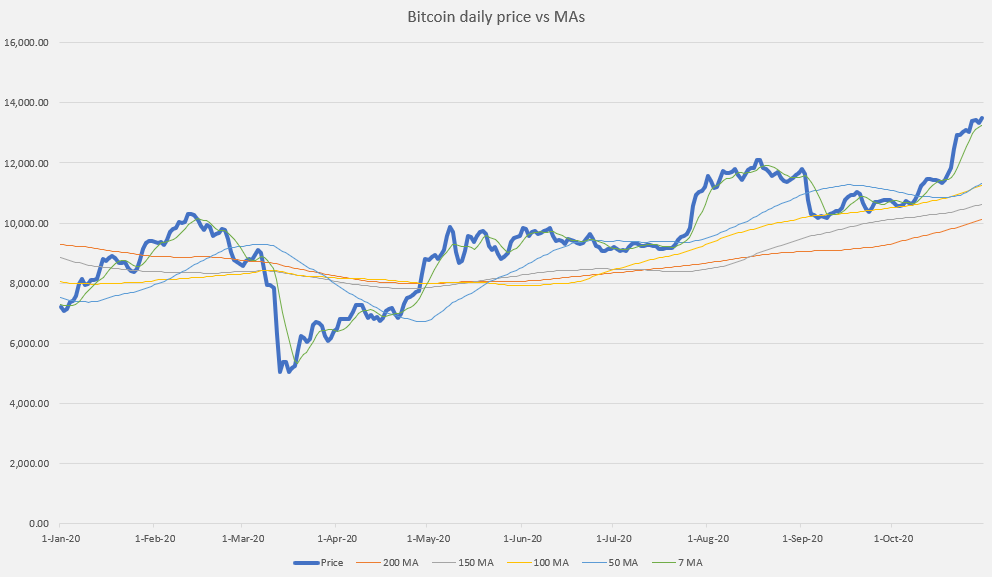
A quick glance at the chart would reveal the number of entry and exit point you’d be taking, depending on which MA you’d pick, of course. It’s clear to see that a short-term MA like the 7-day or the 50-day tracks the price closer, requiring a lot more entries and exits, than a long-term like the 200-day or the 150-day. This feature is detailed in each of the period-wise analysis below and does point to a key trend to keep in mind when using this approach.
A note for the bulls
Before we get into the period breakdowns, a quick note on the bullish nature of the market. Most strategies this year will prove fruitful, especially those that are buy-only or buy-heavy because the market has been moving up. If you simply bought and held on to Bitcoin from the start of the year until now, you’d have earned an 87.5 percent ROI, that’s not considering transaction and withdrawal fees, and inflation, albeit for a 10 month period.
However, this approach provides a well averaged out signal i.e. the MAs, and hence can be relied upon to a sufficient degree. In a bearish year, think 2018, when the price was plummeting, an approach like this would simply tell you not to buy Bitcoin because there were no historic uptrends, courtesy of the MAs. In such a year, you’d just not end up buying, and instead of making a 75 percent loss (buying on January 1 2018 and holding on till December 31 2018), you’d end up making either a profit, nor a loss.
With the housekeeping done, let’s get into it.
200-day moving average
The 200 DMA is one of the most relied on indicators, forming one half of the golden and death crossover. Ecoinometrics details the same in the analysis using a long-short approach. So, how often would you end up buying Bitcoin in 2020 using the 200DMA?
| 200DMA | Value |
| No of buys | 220 |
| Average price | $ 10,236.61 |
| Entries | 3 |
| Exit | 2 |
| Total moves | 5 |
| Price per move | $ 2,047.32 |
| Absolute profit (against 30 October) |
31.9% |
You’d end up entering the markets on three occasions. These three occasions would total to 220 days of buying Bitcoin every day. The exits you’d take are simply pausing your DCA, not selling. If you count the exit as a “move,” you’d have a total of 5 moves made by the end of the period (1 January to 30 October). The average price of each buy is at $10,236, on the higher side considering the low to high range of Bitcoin for the year is $5,000 to $13,500, but this is because you’re paying a premium as mentioned above.
The advantage of this approach is it’s hassle-free. Just three times you’d have to hit play, so to speak, on your daily buys. Only twice do you have to hit pause. Think about it this way, the average price you’re left with per move is $2,047, meaning each move made you a significant chunk, despite making so few moves in total. Lastly, the profit you’re left with as of 30 October, is 31.9%.
Stick around
A quick recap. We’re looking at when to buy Bitcoin, based on a buy-only strategy, using just one indicator scaled for several periods, with strict, but wide-ranging rules. So far, we’ve laid out the name of the game, the rules we will follow, the market since the beginning of the year, a note on the bulls, and the first iteration of the study based on the 200DMA.
This is part one of a two-part analysis on when to buy Bitcoin using this MA and buy-only approach. In the next part, we’ll break it down for the 150DMA, the 100DMA, the 50DMA, and the 7DMA, with varying profit margins, and transaction counts, with some surprising results.