Tezos came very close to hitting an all-time high after XTZ’s price surged by over 13 percent in just 24 hours. Since the start of July, the price action has been very promising for Tezos and this has since almost doubled. While XTZ’s price has seen a few ups and downs lately, strong bullish momentum over the past week has propelled the cryptocurrency to new heights.
At press time, Tezos was being traded at $4.2 and noted a market cap of $3.1 billion with a 24-hour trading volume of $543 million.
Tezos 1-day chart
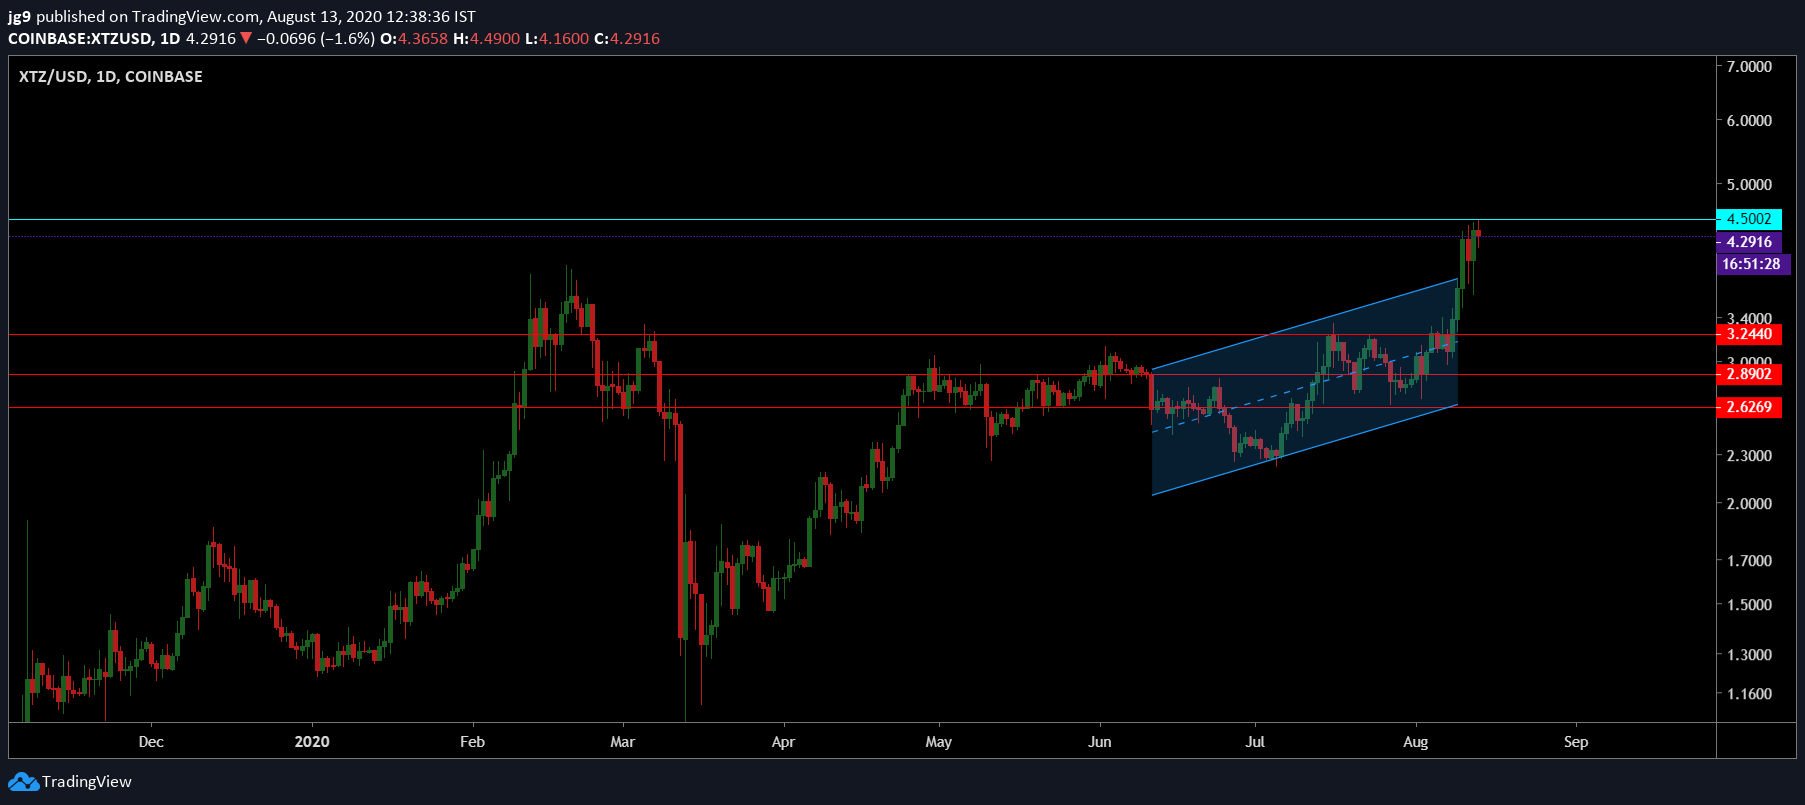
Source: XTZ/USD, TradingView
According to Tezos’s daily chart, the price movement of the coin had been confined to an ascending channel formation right from the start of June. During the course of the past few days, however, the price has broken out of the formation and moved in an unconventional direction – upwards. This has enabled the price of Tezos to hit an ATH and go past levels last seen in February 2020.
Since 10 August, the price action of Tezos has found strong resistance at $4.5 and despite a few attempts at breaching it, the resistance remained strong, at press time. However, if the coin is unable to go past the resistance and bearish momentum kicks in, the price is likely to head towards its support level at $3.2 in a week’s time. Further, there were two more strong supports at $2.8 and $2.6, if the price drop were to take Tezos’s price back to early-May levels.
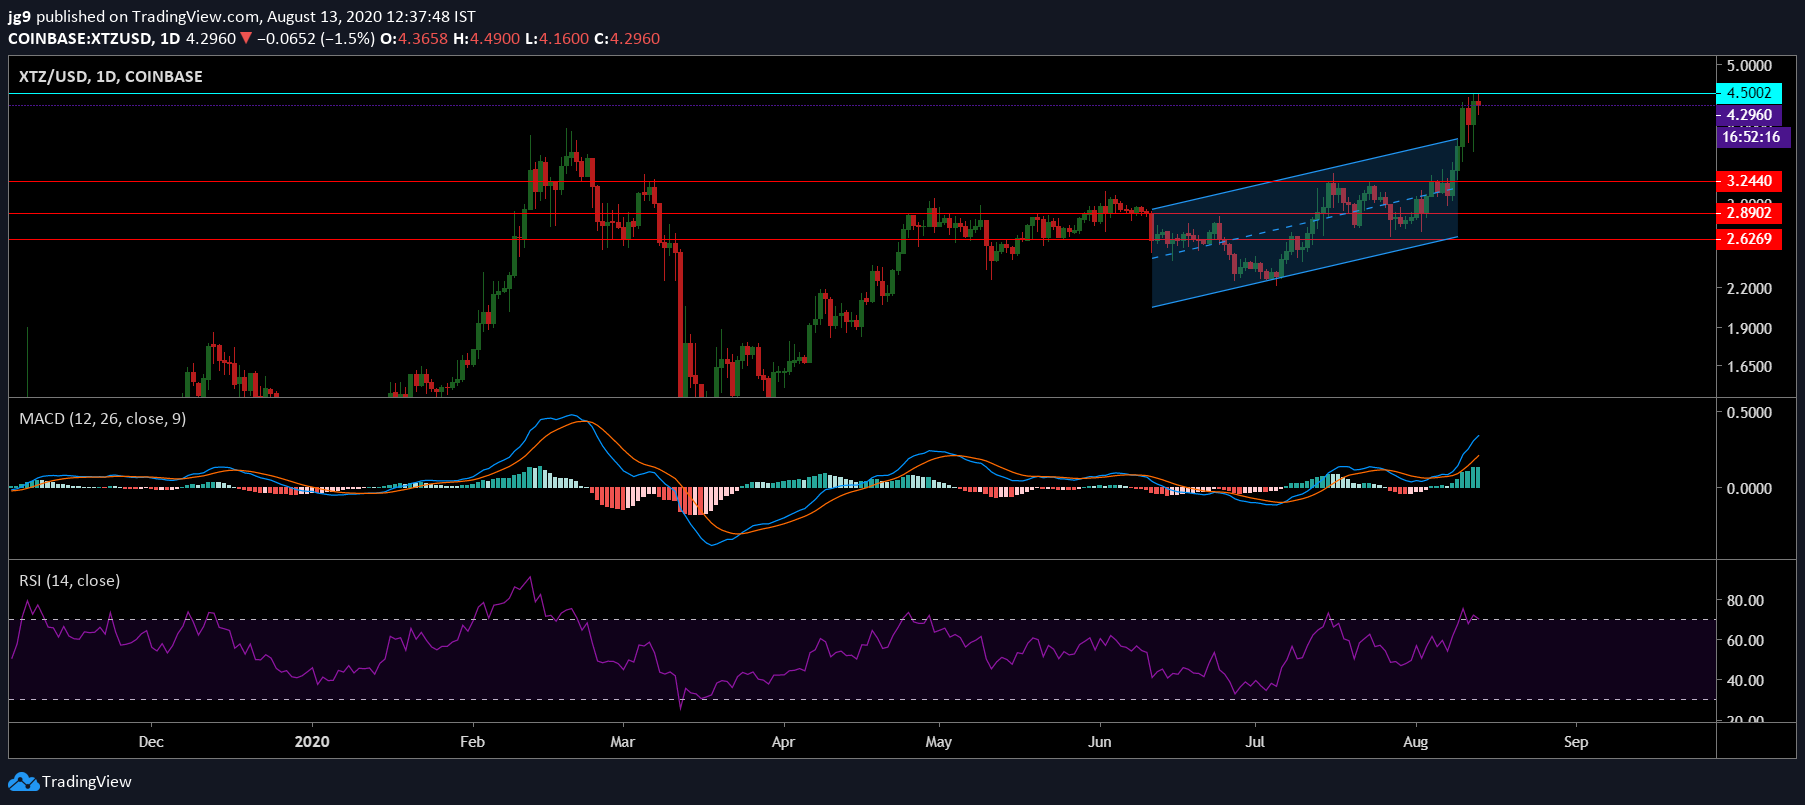
Source: XTZ/USD, TradingView
Interestingly, the technical indicators for the coin were showing strong bullish momentum on the charts. The MACD indicator underwent a bullish crossover and there were no signs of a reversal, at the time of writing. Further, the RSI indicator echoed a similar sentiment and was settled well inside the overbought zone.
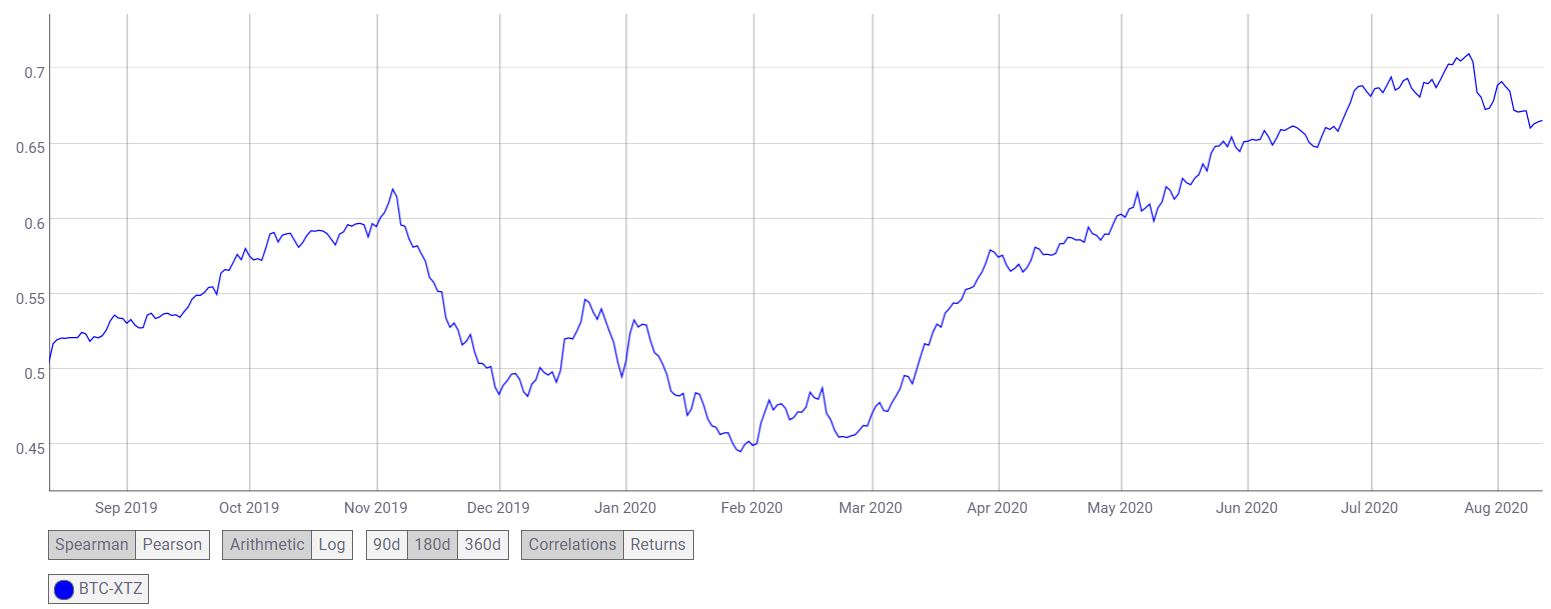
Source: CoinMetrics
Akin to most altcoins in the market, Tezos has enjoyed a high correlation with Bitcoin. Over the last year, the correlation has risen, with the BTC-XTZ correlation rising from 0.45 to 0.66 since March 2020. However, in the past month, the correlation has fallen, a development which is good news and may explain the strong bullish momentum for the coin, despite Bitcoin’s recent woes.
Conclusion
Tezos’s price broke out of the ascending channel formation and was moving upwards. However, if the price is unable to breach the resistance at $4.5, the coin may see its price head towards the support at $3.2 in the coming week.