
Disclaimer: The following analysis traces Tezos’s [XTZ] price movements that led to the price breakout, while also identifying its important support points
The fate of most cryptocurrencies is intertwined with that of Bitcoin [BTC], the world’s premier cryptocurrency, due to its high correlation with the market’s altcoins. However, with Bitcoin’s market consolidating over the past few weeks, many of these altcoins have been moving farther away from the fortunes of the king coin.
Tezos [XTZ] was the best performing crypto-asset in 2019 and it has maintained its market momentum going into 2020. However, while investors in the crypto-asset noted 77% in profits in 2020, the cryptocurrency’s press time movement seemed to highlight bearishness in the market.
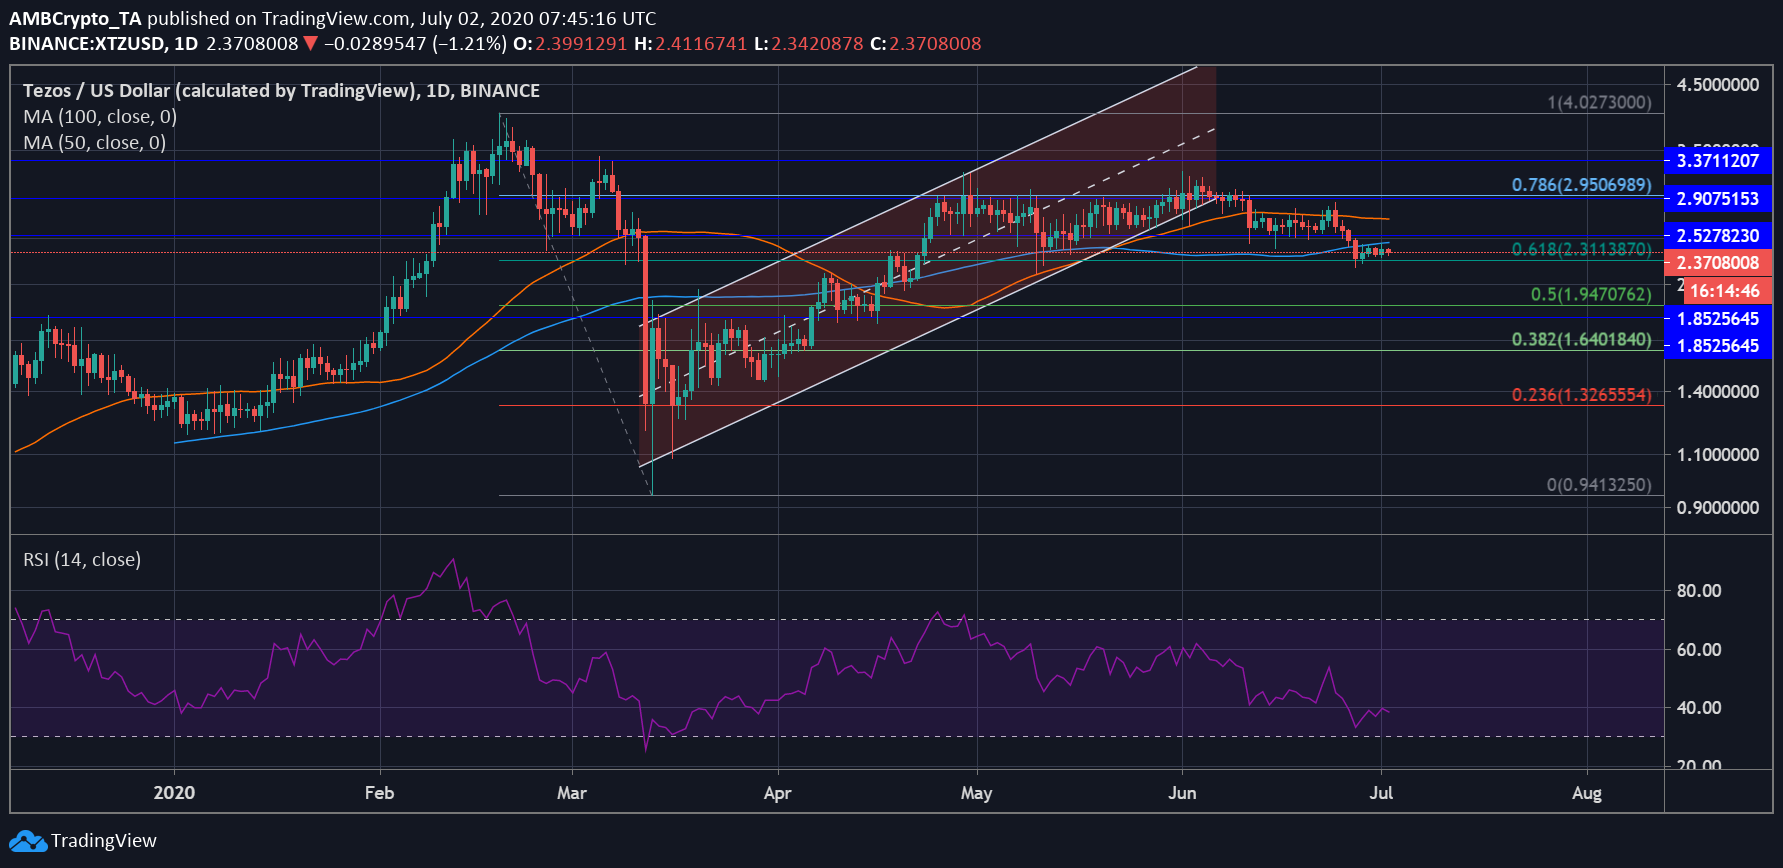
Source: XTZ/USD on TradingView
XTZ’s price had been rallying since the fall that followed the Black Thursday market crash in March. The coin’s upwards movement established an ascending channel pattern, one that later resulted in a breakout. As XTZ’s price peaked close to $3, bearishness crept into the market and the price collapsed, as demonstrated by the attached chart. In fact, the breakout also paved the way for volatility in the market as the value of XTZ fell to $2.36.
The Daily Moving Averages [DMA] also registered this downturn in the market as the 50 DMA [Orange] and 100 DMA [Blue] both were observed to be above the price candles. The press time price point was close to its support at $2.30, as directed by Fib retracement for the year. If XTZ’s price were to fall under the 0.618, its value could depreciate and fall to $1.9, wherein the next support has been marked.
The Relative Strength Index [RSI] was in the seller’s zone, at the time of writing, and was facing downward at 37. The RSI’s value suggested that selling pressure has been gaining momentum, contributing to the bearish outlook of the market.
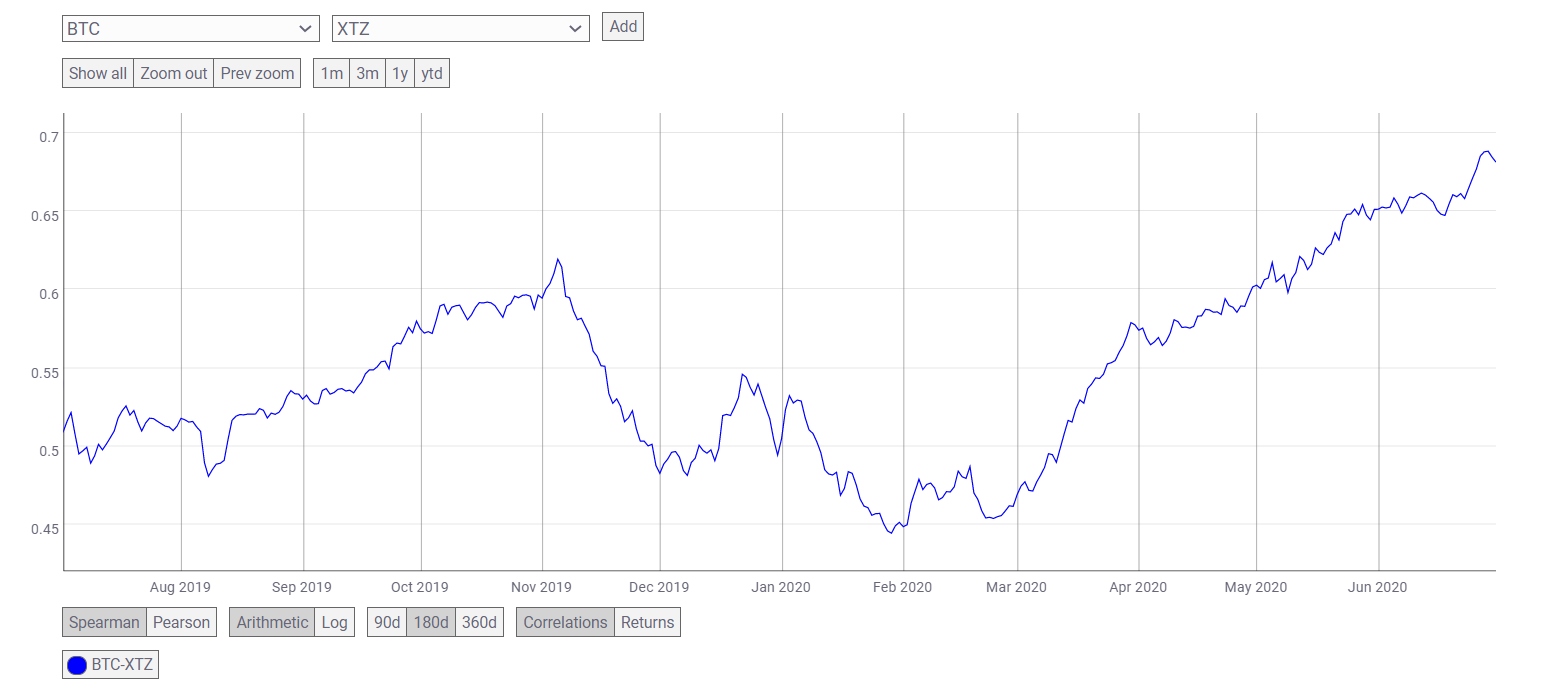
Source: CoinMetrics
This bearishness in the XTZ market might be due to Bitcoin’s price registering a dip in June. As the chart above noted, the rising correlation between the two crypto-assets in 2020 is evident. This increased correlation could have put pressure on the value of XTZ. It was only recently that this correlation pressure started to wane.