Stellar Lumens’ charts pointed to bearishness in the short-term after it was unable to scale a level of resistance. In fact, XLM has been forming lower highs for over a month, highlighting a downtrend over the longer time frame as well. STEEM too formed a bearish pattern on the charts and was poised to drop to a level of support. DASH toiled under bearish pressure and could be set for further losses.
Stellar Lumens [XLM]
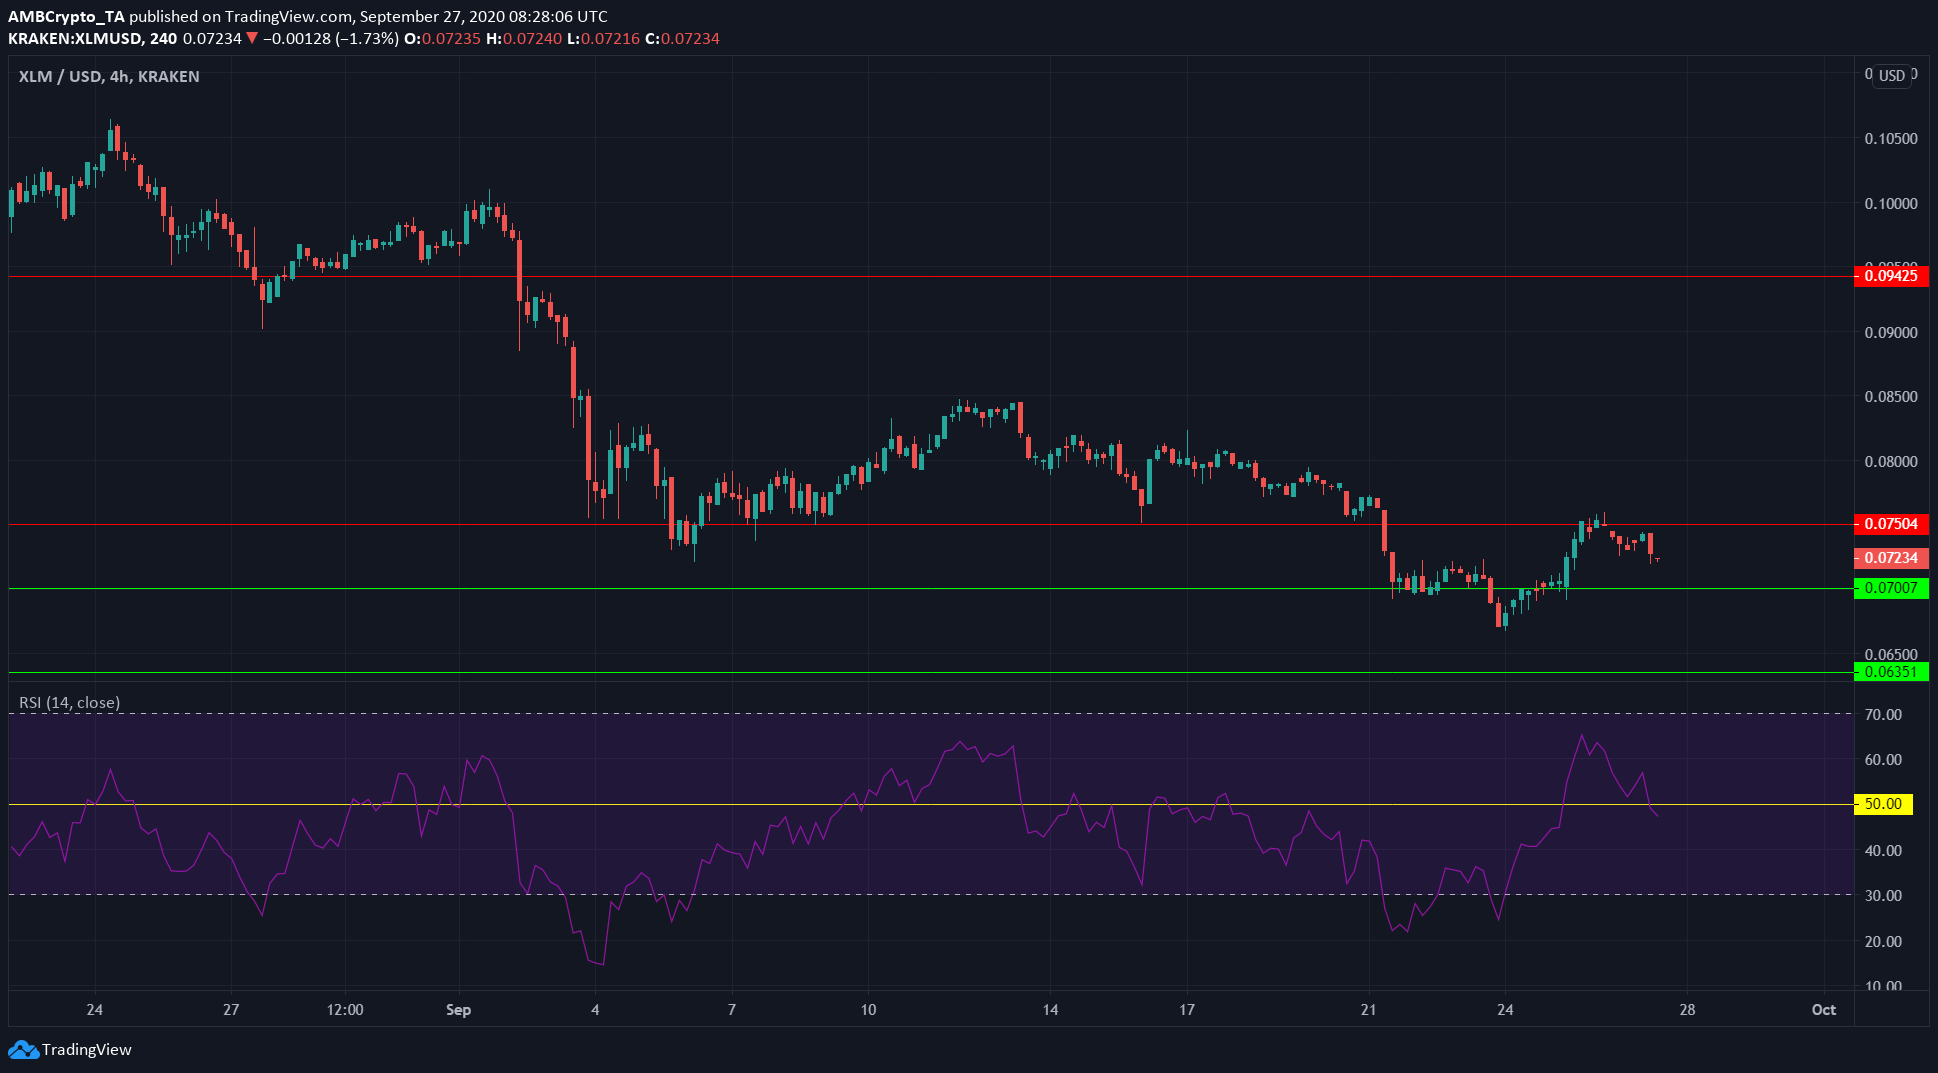
Source: XLM/USD on TradingView
The RSI showed a value of 49, at press time, and closed a trading session beneath its previous low at $0.073. This indicated waning bullish pressure and a failed attempt at resistance.
It was likely that price would be heading back toward the next level of support which lay at $0.07.
The RSI’s value also highlighted neutral momentum. However, over the past few days, the RSI did rise well into the bullish territory. The inability of XLM to maintain its recent bullishness suggests further downside was likely.
Steem [STEEM]
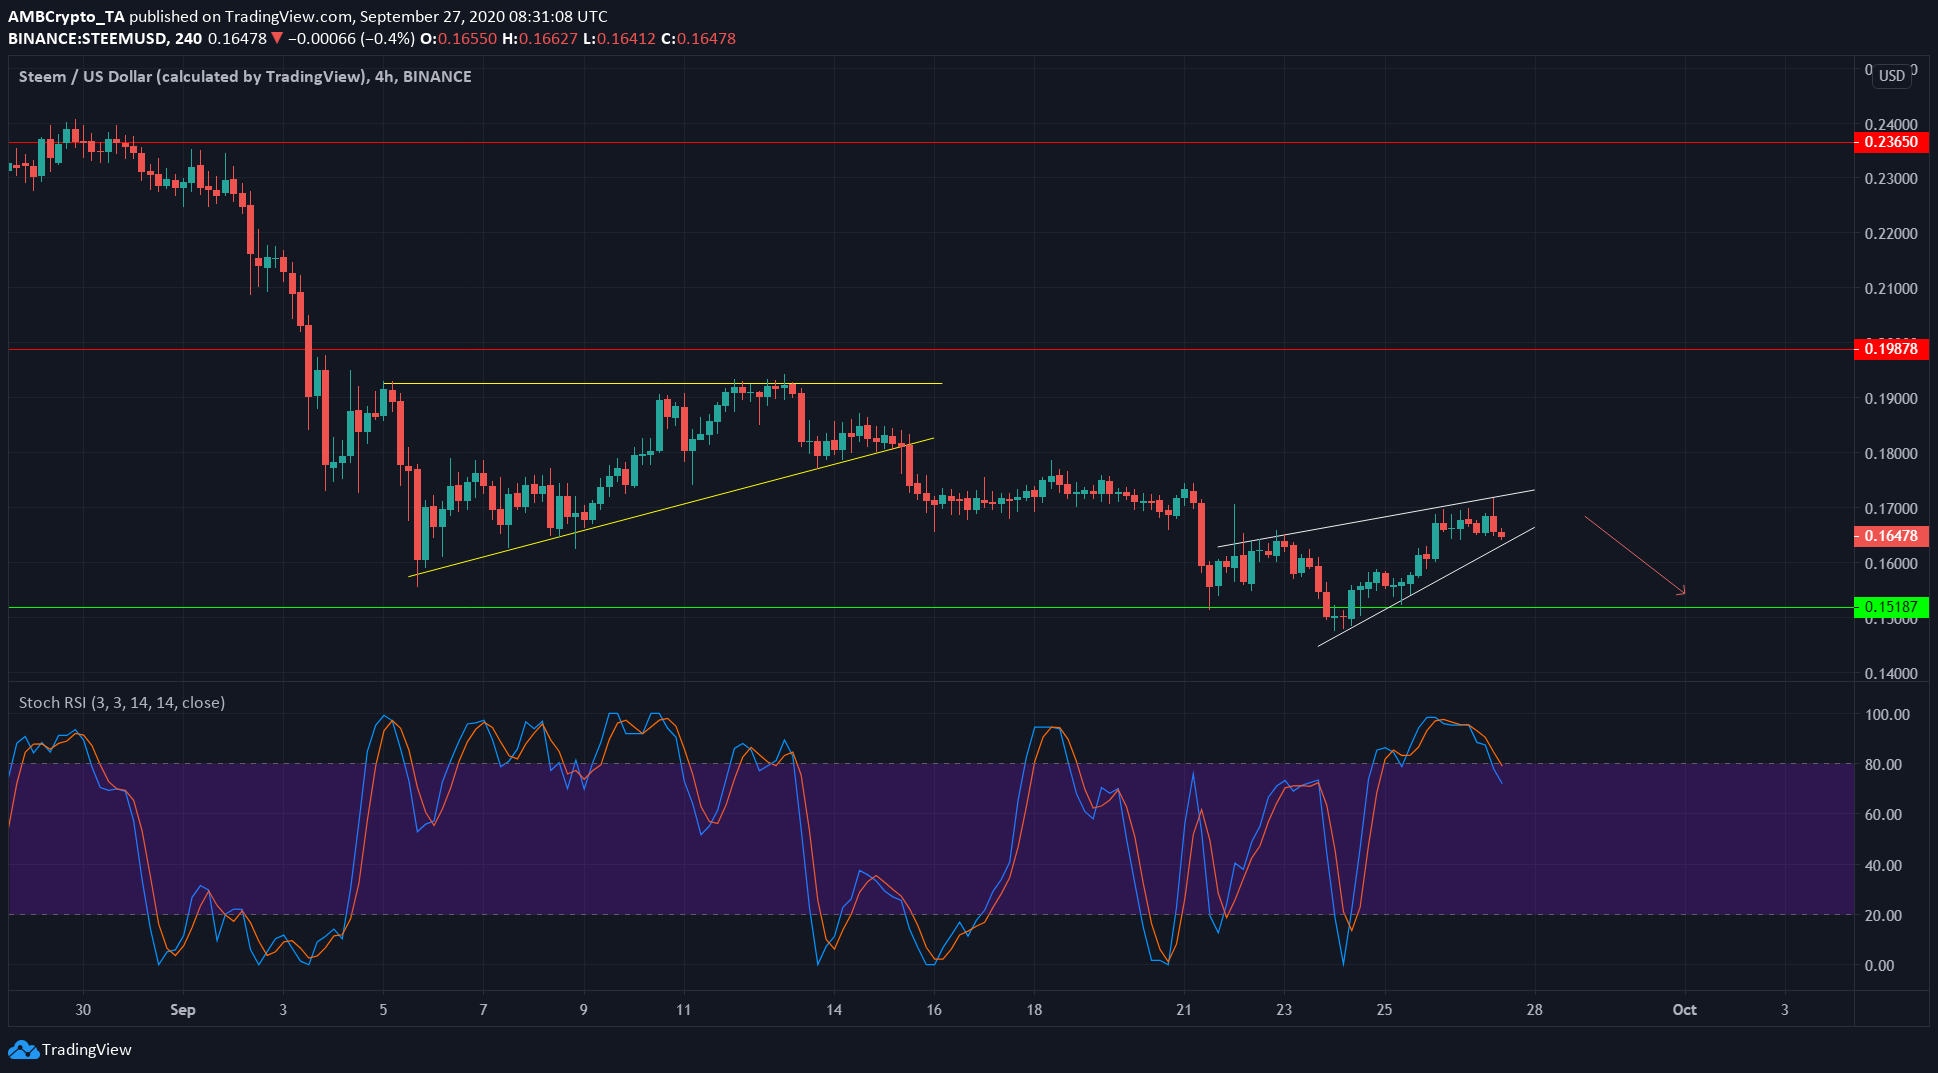
Source: STEEM/USD on TradingView
STEEM was trading at $0.164, at press time. It had formed a descending triangle pattern in the first week of September and broke lower to test the support around the $0.15-region.
More recently, it formed a rising wedge on the charts, another bearish pattern. The price can be expected to reach the base of the pattern, which would again be the support level at $0.151.
The Stochastic RSI registered a bearish crossover after treading into oversold territory, reinforcing the notion of short-term bearishness for the crypto-asset.
Dash [DASH]
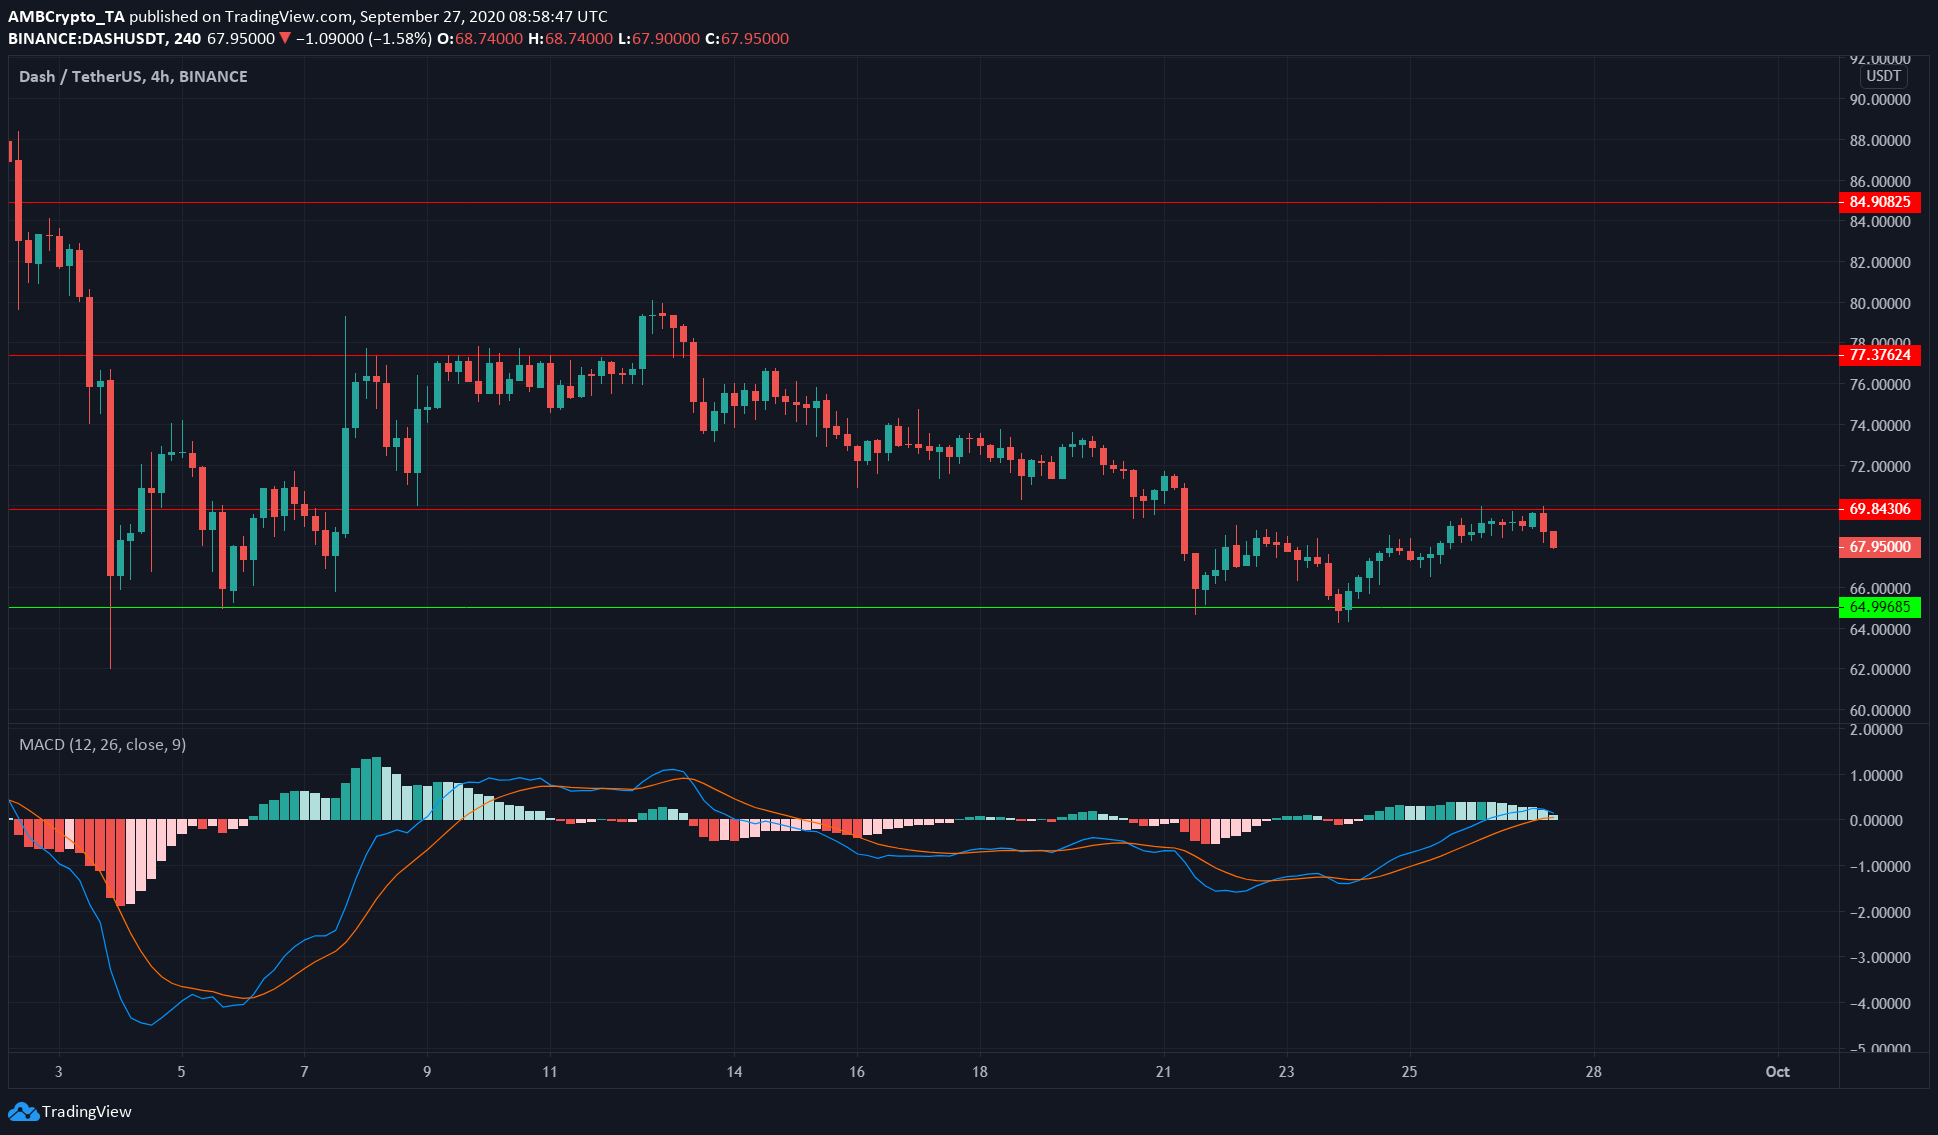
Source: DASH/USDT on TradingView
DASH faced resistance at $69.8, a level that it was unable to overcome. While the longer timeframe trend has been bearish, DASH was able to see some brief periods of relief.
The most recent bounce off the support at $65 was likely finished, and the price was likely to be headed back lower. The MACD was just above the zero line and had formed a bullish crossover a few days ago.
Further losses to DASH could take the MACD back below the zero line, while also noting a bearish crossover. This would send a strong sell signal to the market.