
While Bitcoin did dip briefly under $16,000, the sentiment around BTC remained strongly bullish, which is why the buyers were assertive enough to later push the price to $16,117, at press time.
Further down the crypto-ladder, Stellar Lumens saw traders take-profit upon a push past the resistance level. Bitcoin Gold was trading within a range but had good buyer interest behind it, while FTX Token could see losses in the coming days.
Stellar Lumens [XLM]
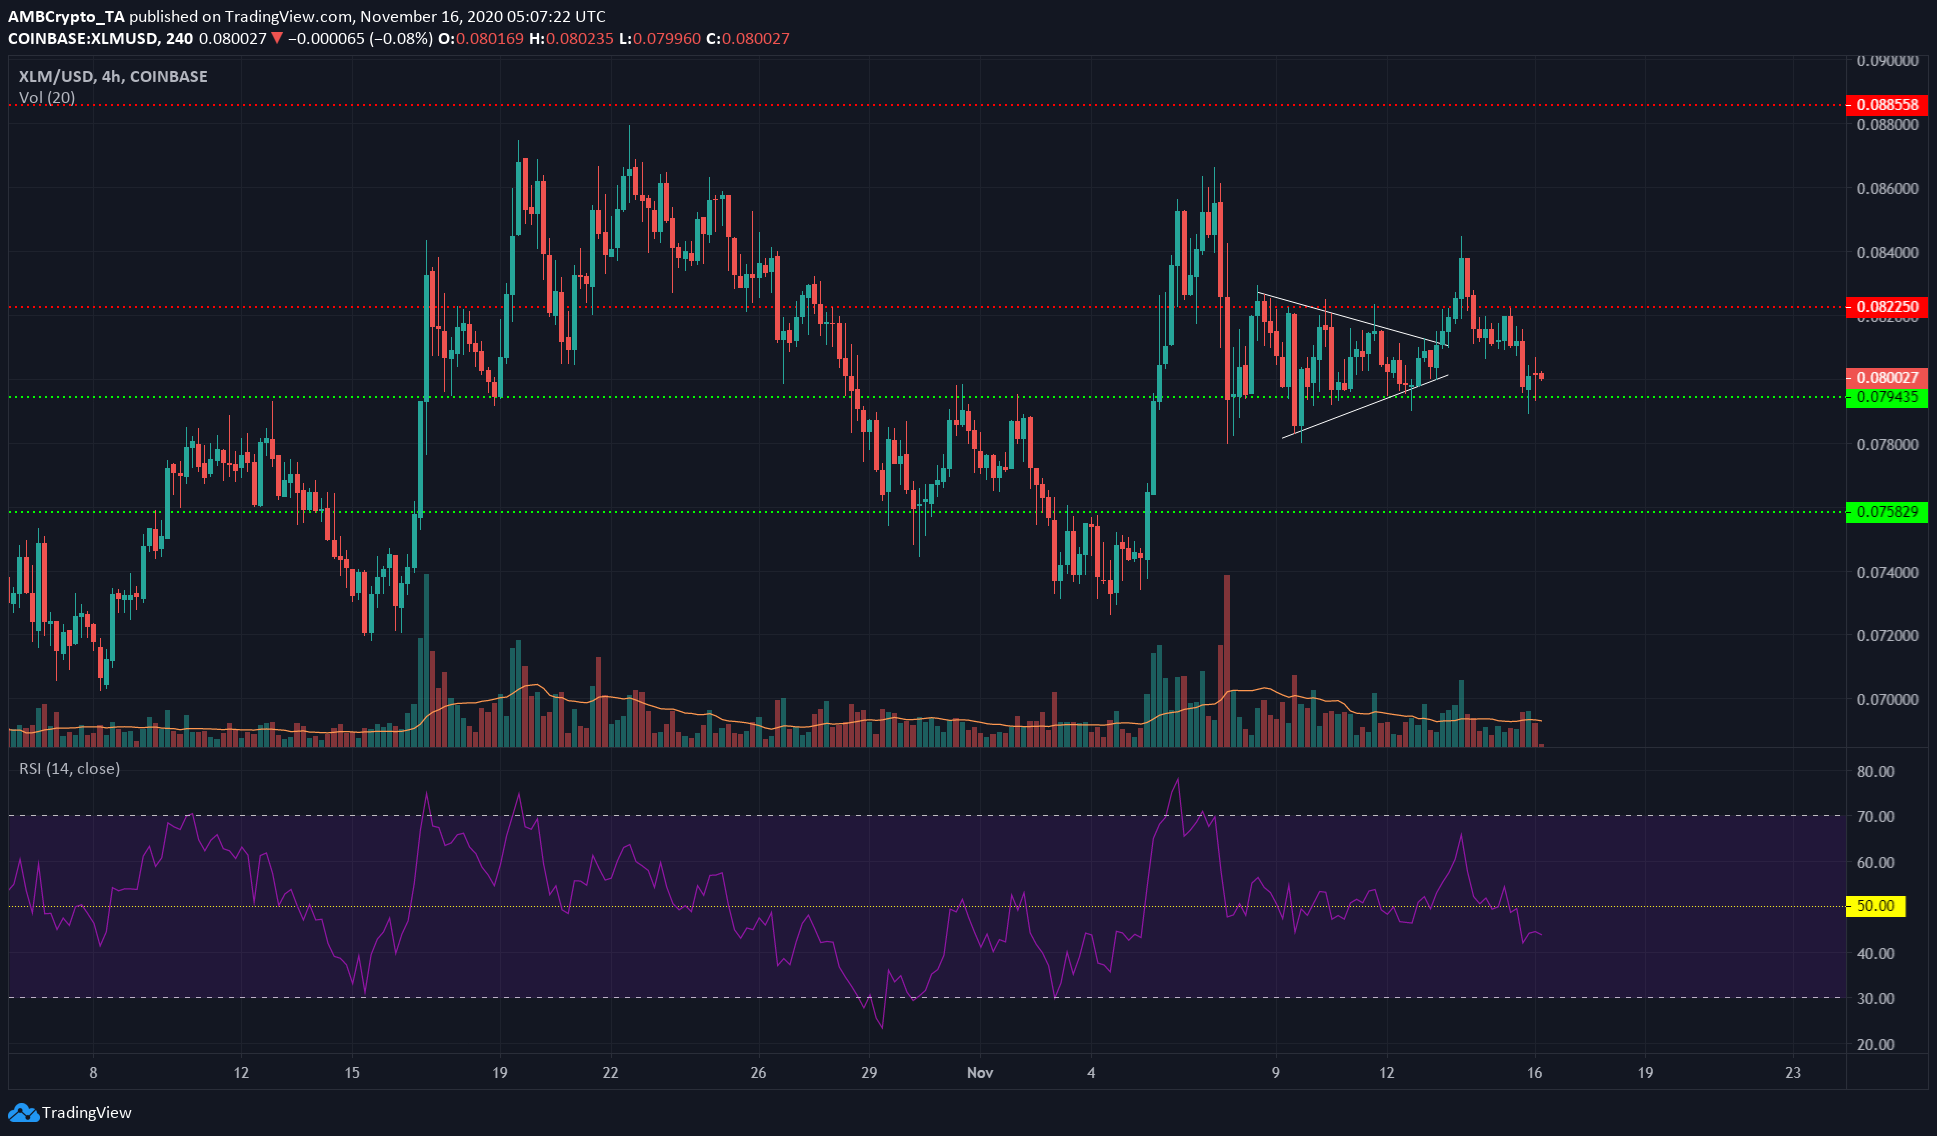
Source: XLM/USD on TradingView
Stellar Lumens formed a symmetrical triangle pattern (white), broke out strongly to the upside, and pushed past its resistance level at $0.082.
However, XLM was unable to flip the level of resistance to support and the price was pushed back towards the support at $0.079.
The RSI also fell under 50 to denote a switch to bearish momentum on the charts. In fact, the past few weeks have seen XLM post sudden surges, then retrace most of the move, before surging north again.
If the pattern is followed further, XLM might see more losses in the coming days to find support around $0.075.
Bitcoin Gold [BTG]
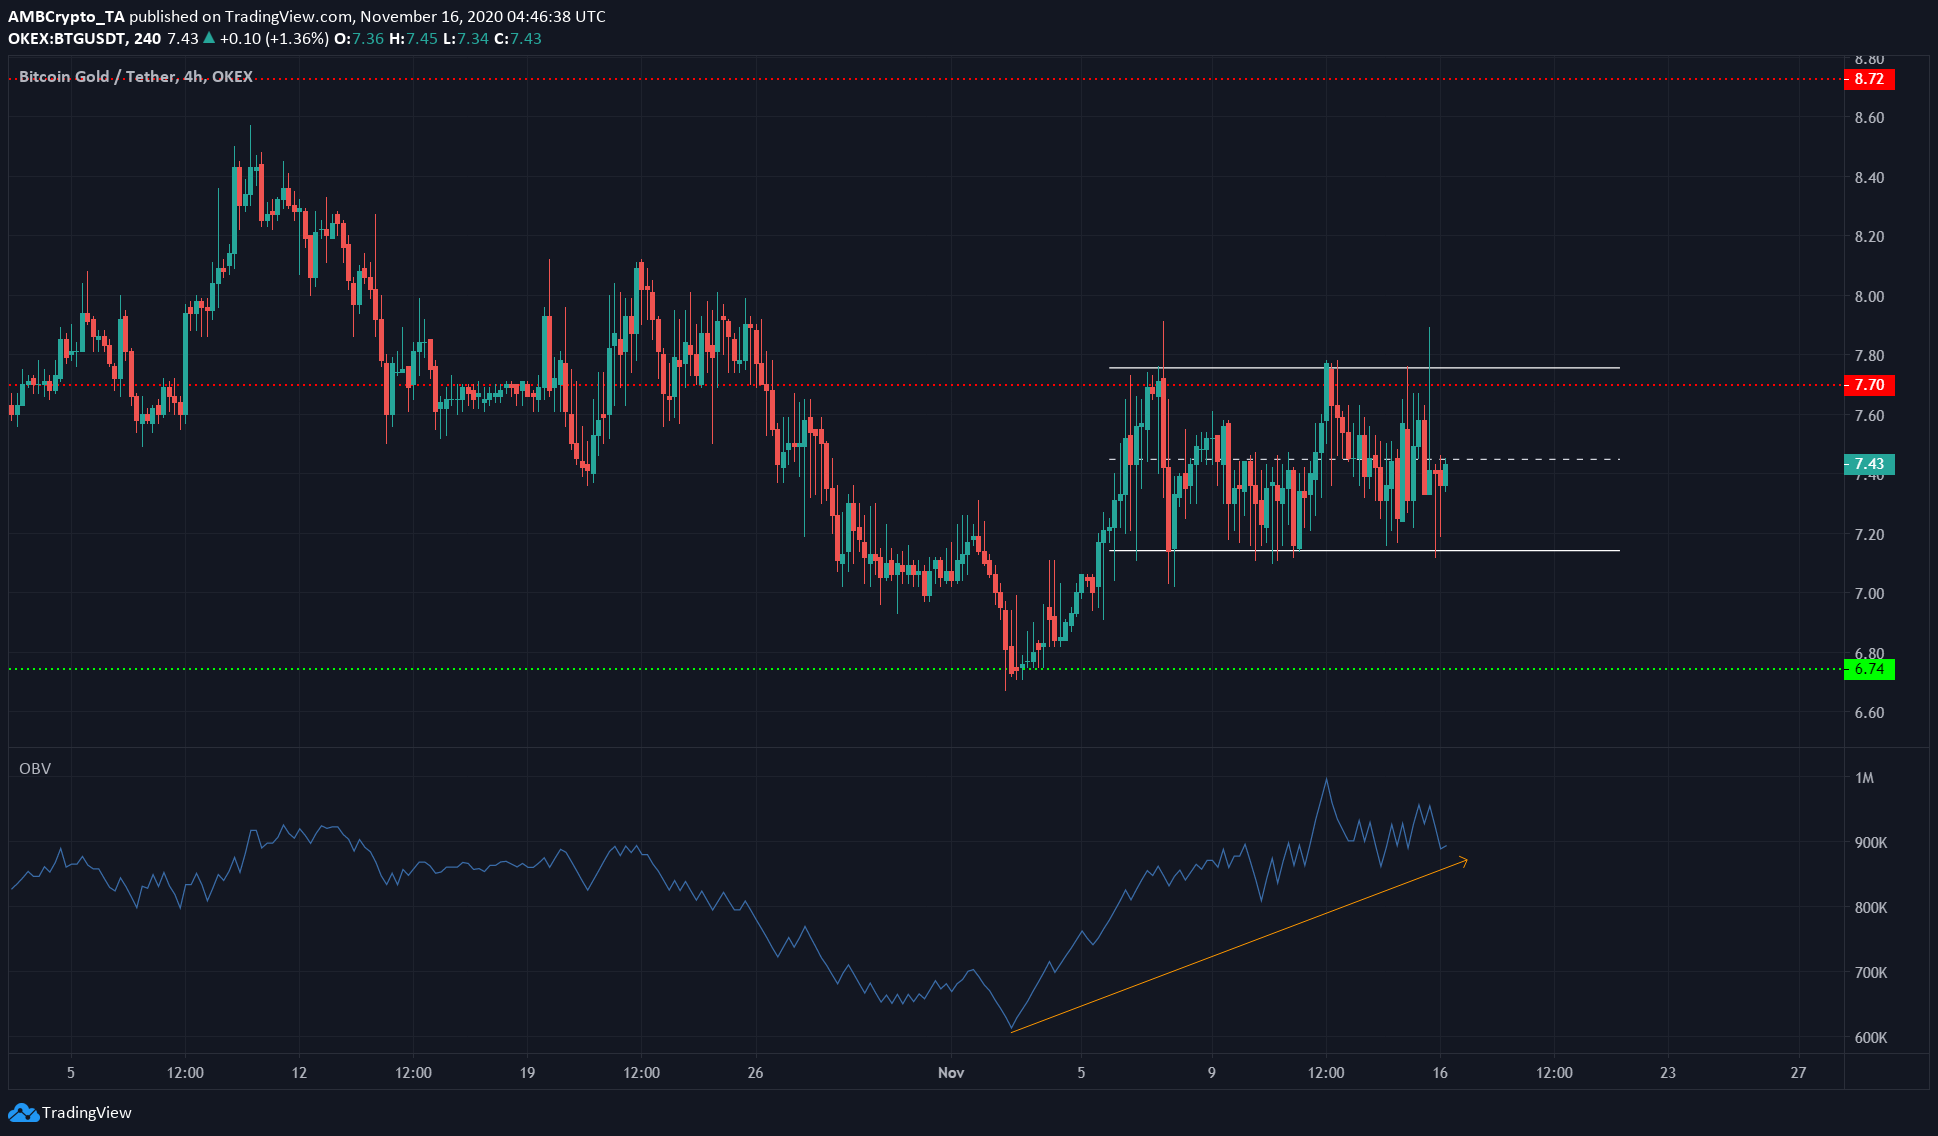
Source: BTG/USDT on TradingView
Bitcoin Gold was trading within a rectangle pattern (white) under the resistance at $7.7. The OBV, over the past two weeks, has been rising, highlighting growing buy volume (orange) in the market.
This healthy buyer interest in the short-term could push the price upwards, past its resistance, leading to a breakout to the upside of the rectangle.
A close below $7.15 for BTG could take the price to the support at $6.74.
FTX Token [FTT]
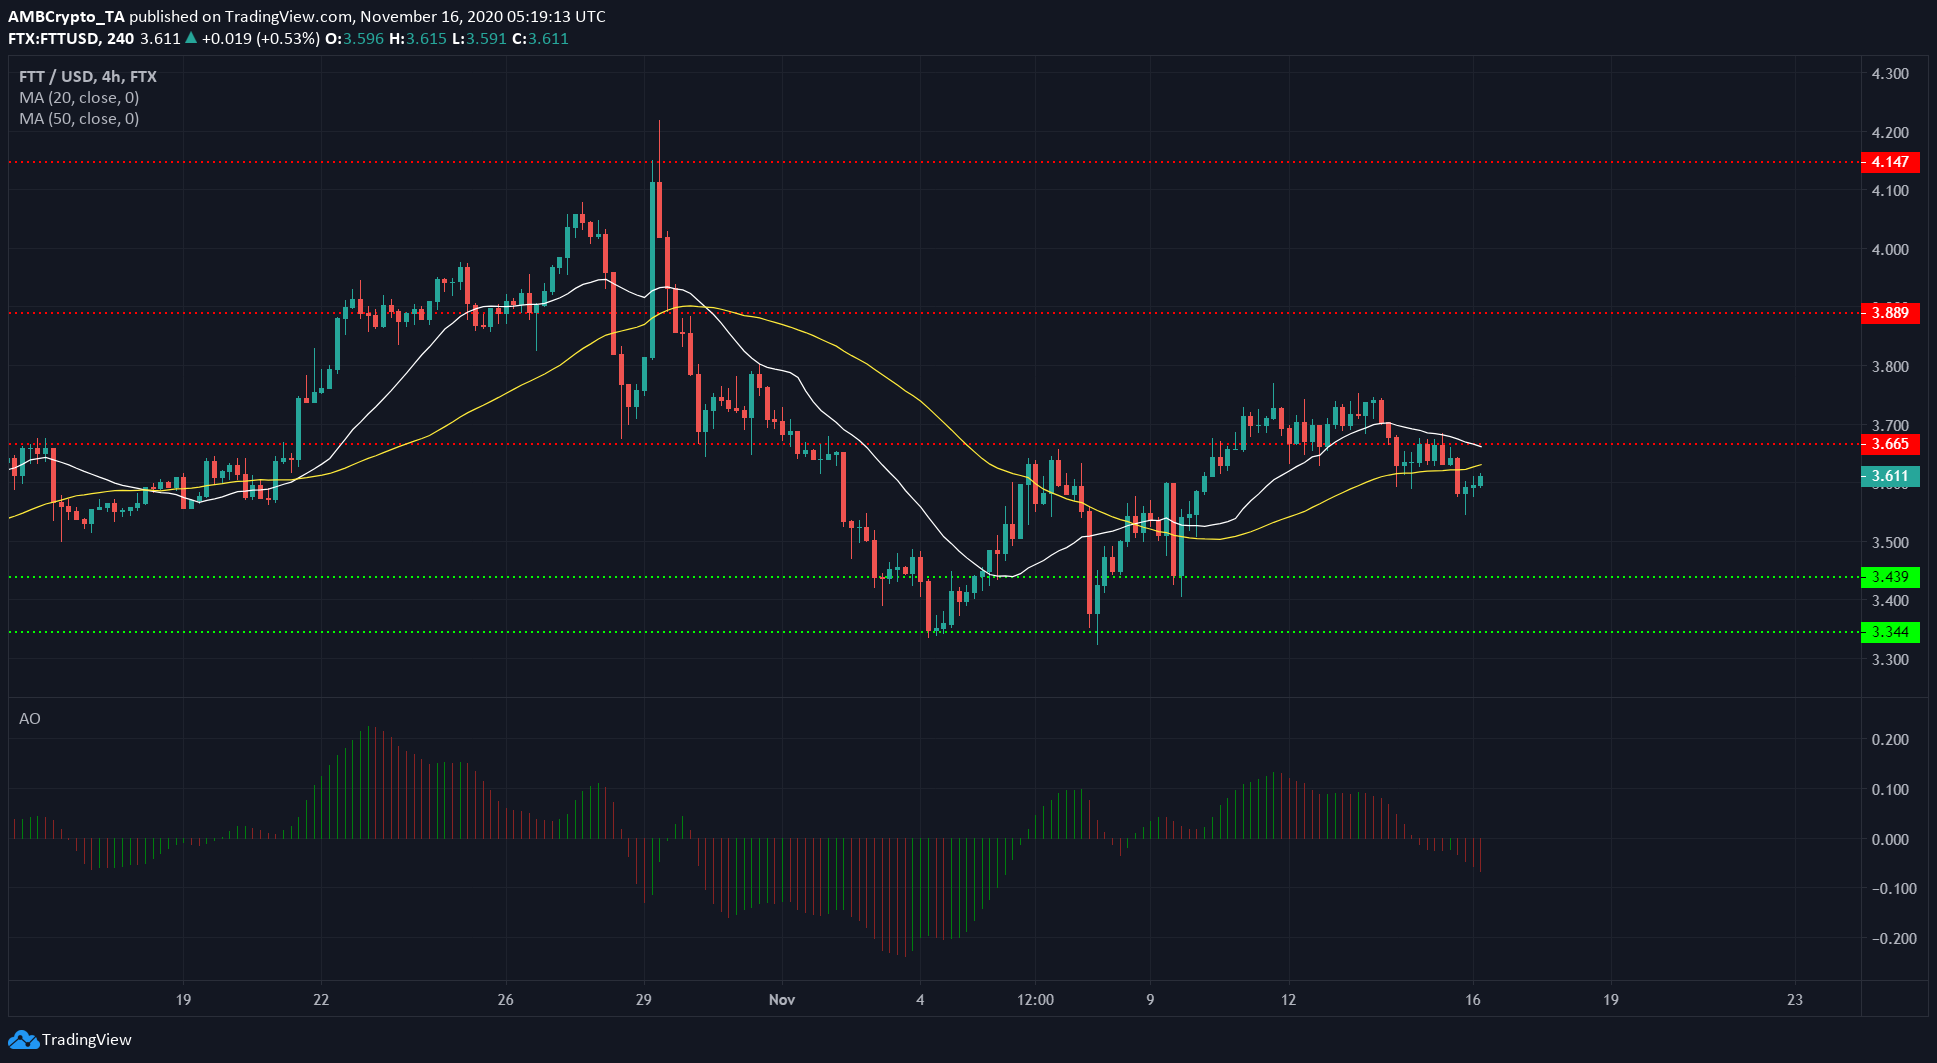
Source: FTT/USD on TradingView
The 20 and 50 SMA (white and yellow respectively) were moving above the price. FTT was trading under the resistance at $3.66. The Awesome Oscillator also showed that bearish momentum was building for the token.
Taken together, this was a bearish scenario for FTT. It can be expected to find resistance from the moving averages, making it likely that the coin would be forced lower in the coming days.
This month, FTT has defended the support at $3.34 strongly and moved upwards to claim the level of resistance at $3.66 as support. The loss of the same was a sign of rising bearish pressure in the market.