Ethereum formed a local bottom at $375. Bitcoin was rising past $14,000 alongside Bitcoin Dominance, triggering fear that altcoins would continue to bleed. But news of ETH 2.0 saw the crypto-asset surge to $460 and dragged the rest of the market alongside. Polkadot and Tron surged past levels of resistance as bulls flooded into their markets once more. DigiByte showed mixed signals but was likely to follow the rest of the market.
Polkadot [DOT]

Source: DOT/USDT on TradingView
DOT exhibited a bullish divergence as it found support at the $3.88 level, the 78.6% retracement level of DOT’s move up from $3.6 to $4.95.
Combined with a surging Ethereum, DOT bulls found a wave of strength as they pushed past levels of resistance. An attempt to close above resistance at $4.8 was rejected, and the RSI moved well into overbought territory.
This suggested that a pullback to $4.43 was possible. A corrective wave was likely right around the corner for DOT.
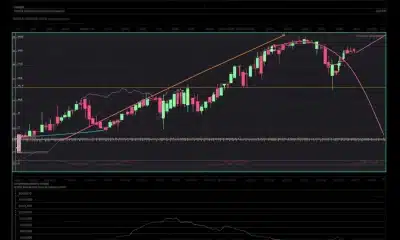
Tron [TRX]

Source: TRX/USDT on TradingView
TRX’s downtrend weakened in the month of October as the price oscillated about the $0.025 level. The losses strengthened in the last week of the month, alongside the rest of the altcoin market.
The first week of November saw TRX move strongly below support at $0.0247, but the price found a local bottom at $0.023 and reversed to the upside.
TRX ascended above its 50 SMA (yellow) and 100 SMA (pink). The next level of resistance at $0.03 has not been tested since mid-September. The next level of interest for TRX lies at $0.028, and a move above could encourage bulls to push for further gains.
DigiByte [DGB]

Source: DGB/USDT on TradingView
There was a bullish divergence spotted (orange) between the price, which made lower lows, and the CMF, which registered higher lows. The OBV also showed increasing buying volumes as DGB found a local bottom in the $0.0186 region.
DGB flipped the level of resistance at $0.02 to support upon a retest of the level and moved further higher. Yet the CMF continued to show seller dominance in the markets.
Another pullback could be in store for DGB. A close above $0.022 would affirm the recent recovery, while a close below $0.02 would signal that bears remained strong.