Both Polkadot and Tezos exhibited a bullish divergence after their recent moves beneath important levels of support. It remained to be seen whether this divergence would cause a bounce or manage to effect a reversal in trend over the next few days. Zcash also rapidly lost levels of support in the past few days.
Polkadot [DOT]
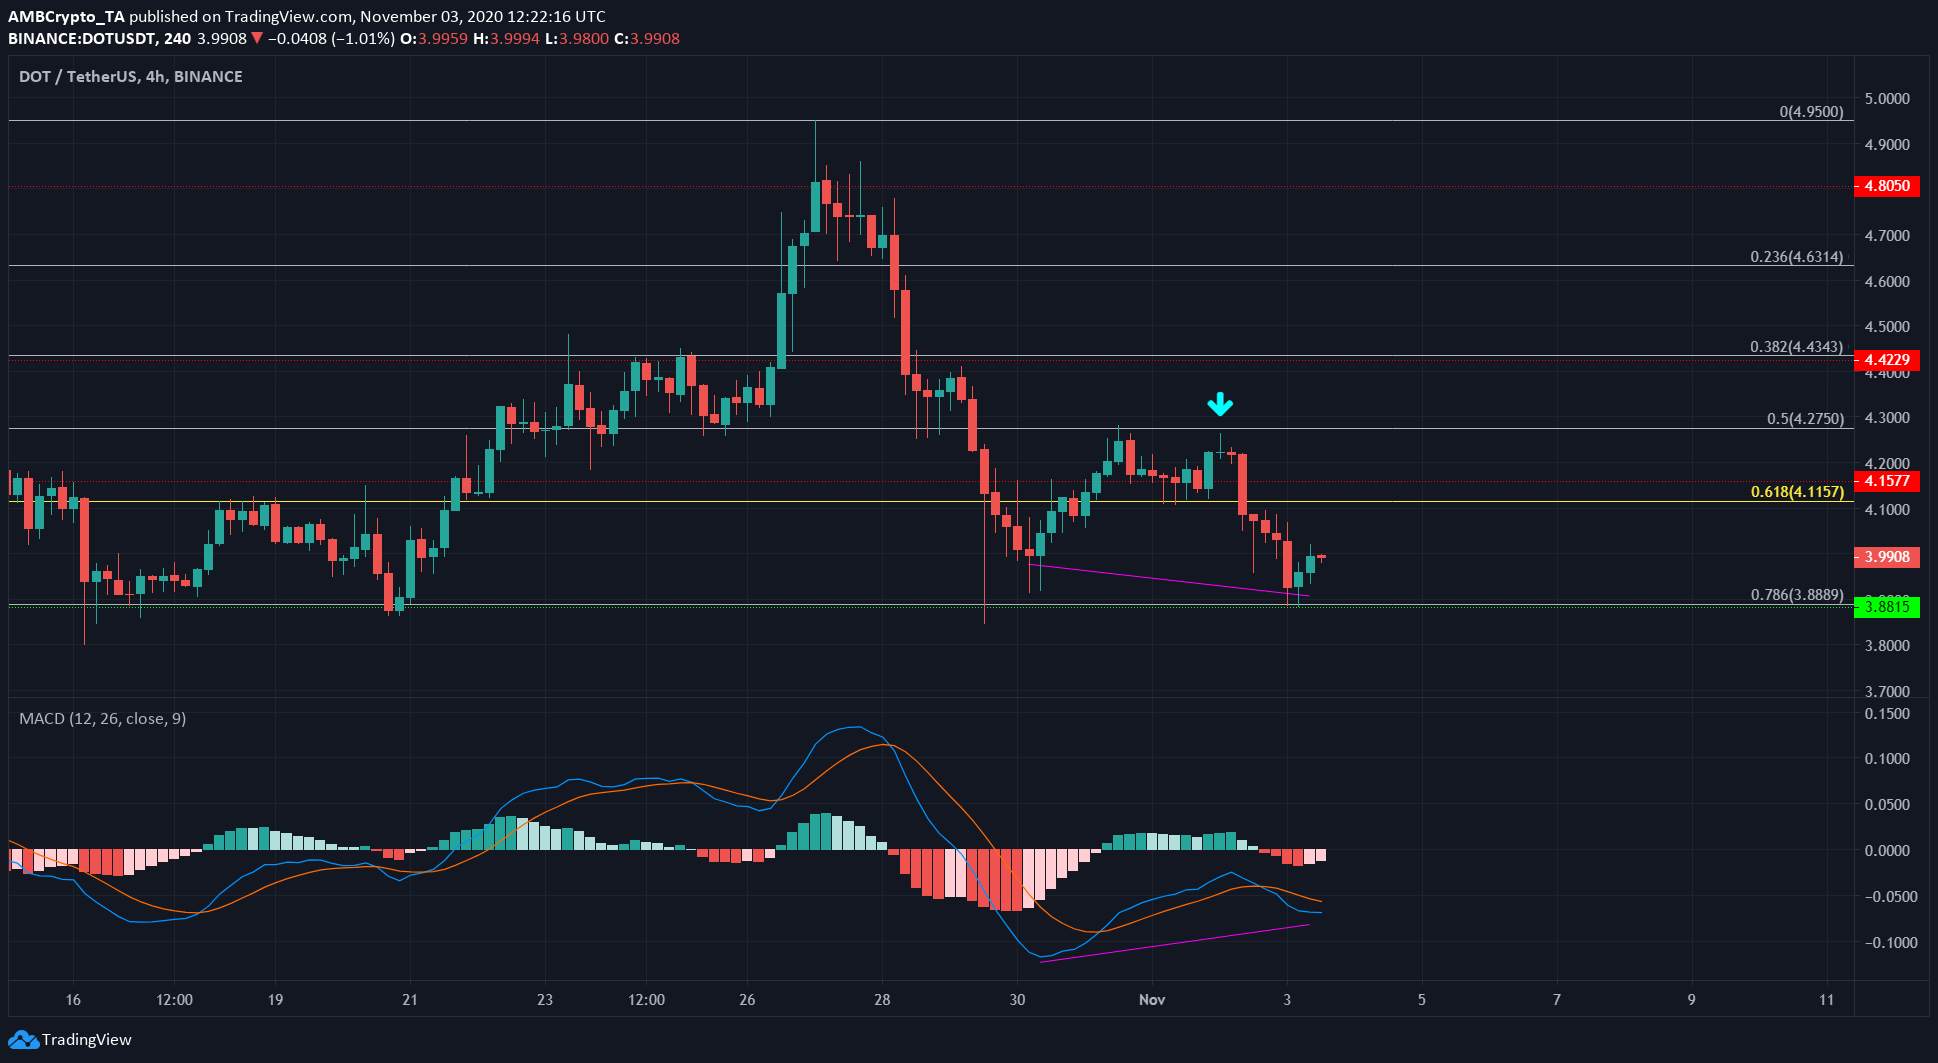
Source: DOT/USDT on TradingView
The Fibonacci Retracement tool was used for DOT’s move up from $3.6 to $4.95 and highlighted some important levels of retracement (white).
The cyan arrow indicated a trading session of indecision as neither buyers nor sellers were able to push the price in either direction. Subsequently, DOT closed beneath the 61.8% retracement level of $4.11. This spelled strong bearish pressure, and DOT was forced lower to test the $3.87 level of support.
However, a bullish divergence was spotted (purple) between price and momentum (MACD). This divergence could see DOT rise to test the $4.11 level as resistance.
Tezos [XTZ]
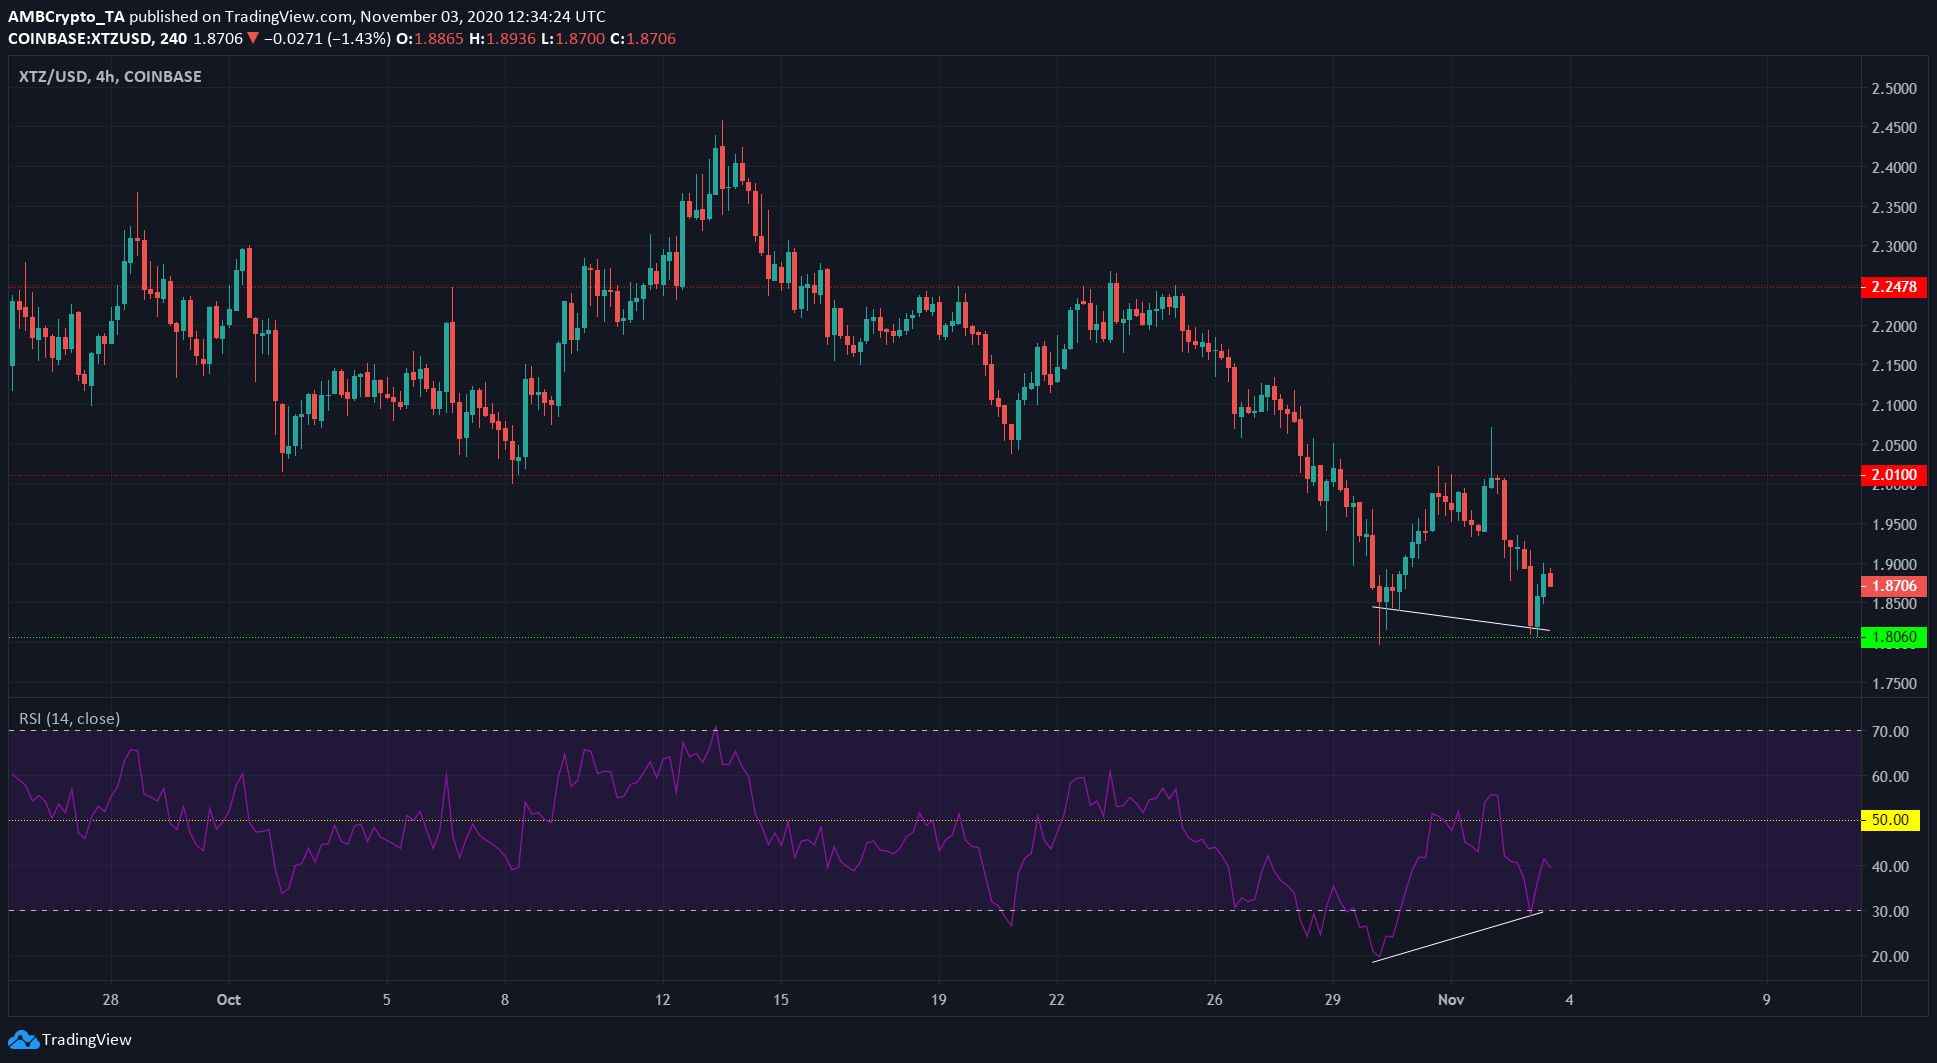
Source: XTZ/USD on TradingView
Tezos dropped beneath $2 support and tested $1.8, then moved upward to test the level flipped to resistance within three days of heightened volatility.
The most recent bounce off $1.8 support saw a bullish divergence exhibited (white) between price and momentum. This could take XTZ to $1.93, but it remained to be seen if XTZ had enough momentum to test $2 once more.
In either case, the price can be expected to reverse to the downside. Confirmation of the same would arrive when trading volume was well above-average.
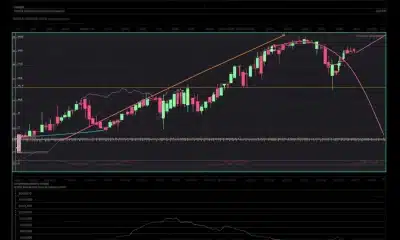
Zcash [ZEC]

Source: ZEC/USDT on TradingView
The white dotted line represented a level where the price could expect resistance and a level that could be pivotal for the crypto-asset. But ZEC was unable to rise past it in the seller dominated market.
CMF showed either that capital flow was headed out of the market in the past three weeks, with brief periods of buying. The OBV backed this finding, as it registered a series of lower highs that suggest selling volume was much greater than buying volume over the same time period.
ZEC has a level of support at $50 that it could drop to in the forthcoming trading sessions, after exhibiting a head and shoulders pattern two days prior.