Bitcoin was trading at $11,344 while Bitcoin Dominance stood at 60.15. The Bitcoin Dominance has been rising slowly since early September, showing that altcoins were facing losses in the market. Polkadot, Cosmos and Ontology toiled under bearish pressure.
Polkadot [DOT]
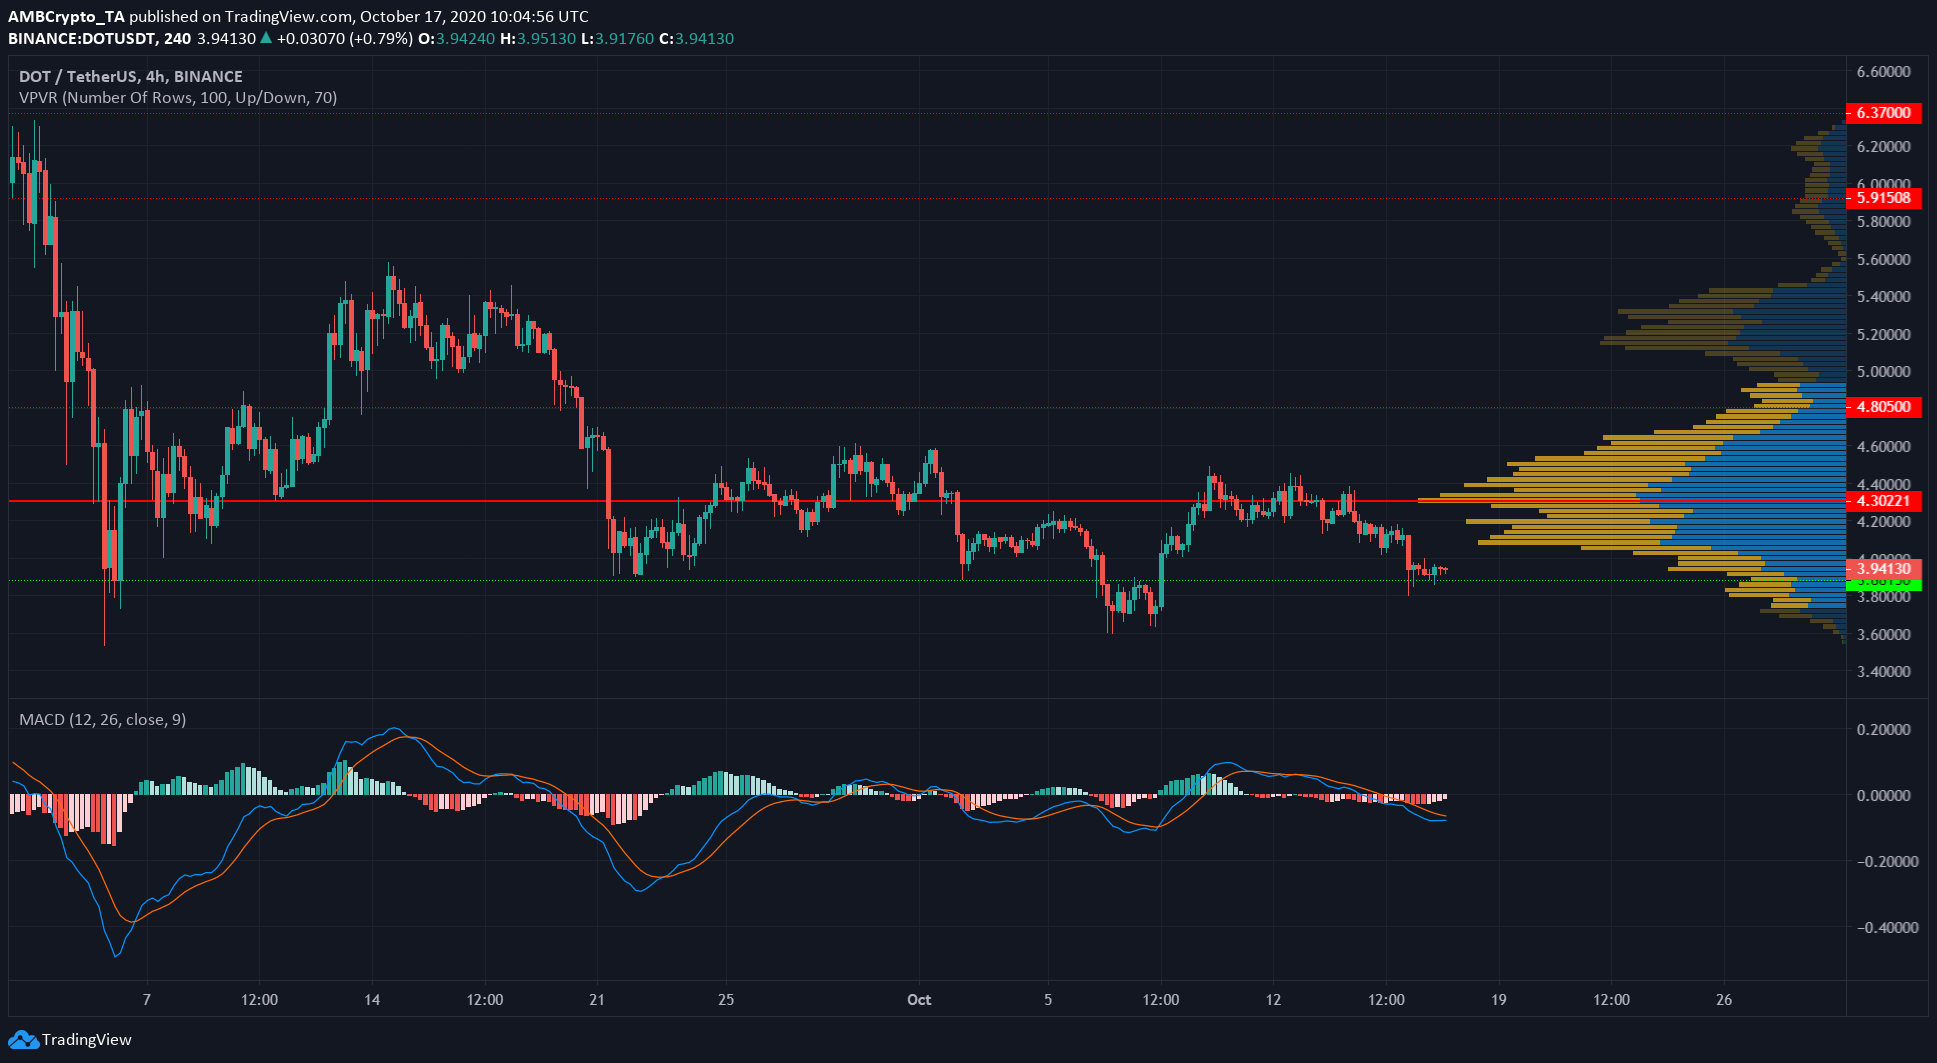
Source: DOT/USDT on TradingView
The MACD generated a strong sell signal as it had formed a bearish crossover and moved beneath the zero line as well.
The VPVR showed that $3.9 and $3.8 were levels the asset could find support at, while $4 and $4.35 were strong levels of resistance, with the Point of Control (PoC) at $4.3.
DOT has used $3.8 as support multiple times in recent weeks, however each bounce was lower than the last. This increased the likelihood that this level of support might be exhausted in the coming days.
In other news, Bitfinex announced staking rewards for Polkadot. It was also revealed that Polkadot had plans to introduce a wrapped asset, “PolkaBTC” in early 2021.
Cosmos [ATOM]

Source: ATOM/USD on TradingView
ATOM appeared to have formed a rectangle pattern (white) on the charts and broken out a few days ago. However, a bearish divergence was seen when the OBV showed a lack of buying volume to legitimize the price hike.
Subsequently, ATOM dipped beneath the $5.4 level and was trading at $5.47 at press time.
In yellow is the floor beneath which ATOM bears would try to force the buying volume. Such overwhelming selling pressure could see ATOM pushed toward $4.8.
It appeared that downward was the direction of least resistance for the asset as the buyers were simply unable to put up a strong defense.
Ontology [ONT]

Source: ONT/USD on TradingView
ONT did not have the strong downward momentum of mid-September but the asset’s bearing on the charts was south. The descending trendline (white) showed how the price has bounced off $0.54 support but failed to breach trendline resistance.
The RSI has been beneath the neutral 50 line for the better part of the past two months. It rose near 50 in the past few trading sessions but the price hardly made gains, indicating further losses for the coin were possible.
It was unlikely for the asset to turn bullish. Downward, or a phase of consolidation at support, were the more likely outcomes for ONT.