Altcoins have been performing well since the start of 2020 and Litecoin’s resurgent run has gained market attention lately as well. On 5 February, Litecoin breached its long-term resistance at $71 for the first time since 16 September. The market has since shown signs of strong consolidation as the crypto-asset was priced at just under $80, at press time. However, Litecoin continued to be ranked 7th on the cryptocurrency charts with a market cap of $5.07 billion.
1-hour chart
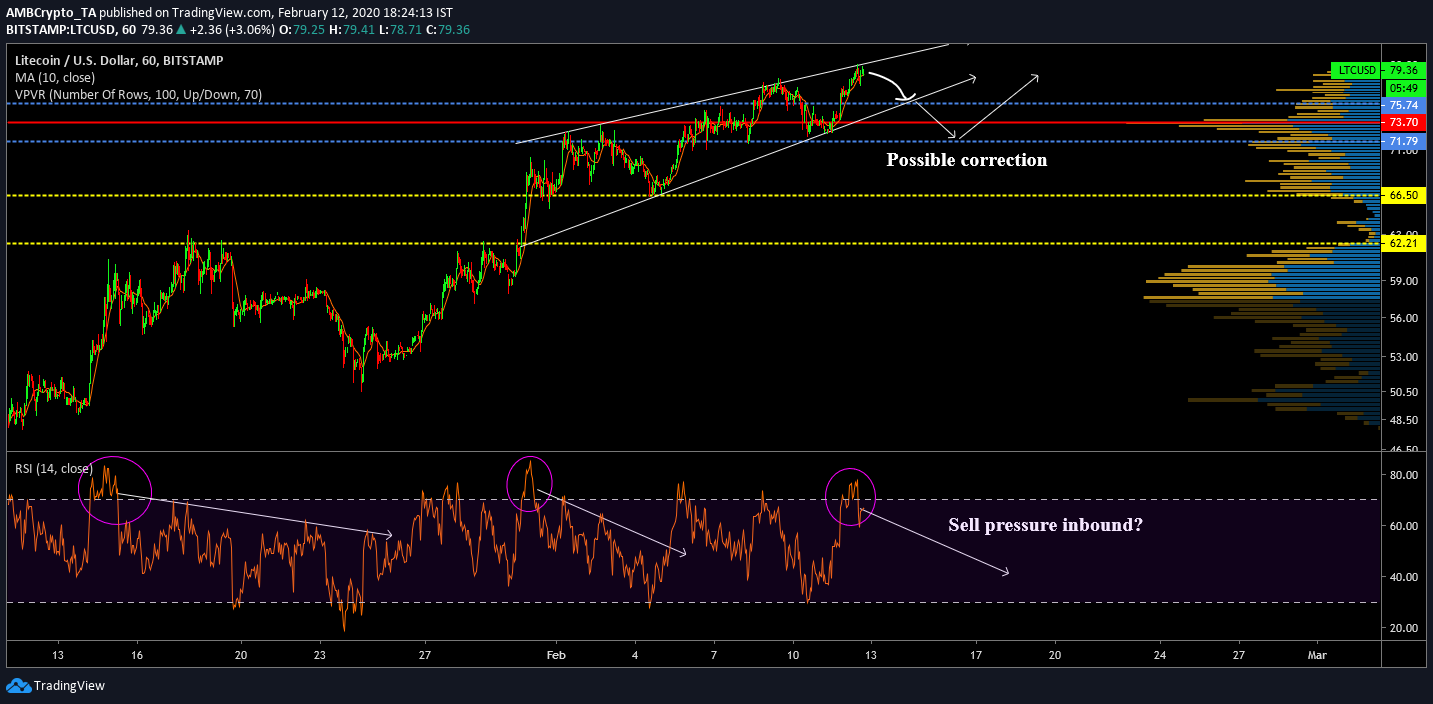
Source: LTC/USD on Trading View
The 1-hour chart for Litecoin has been on a periodic rise over the past 2 weeks. Since the start of February, Litecoin has exhibited the formation of a rising wedge. With respect to the trendlines, higher highs have been registered at $71, $72 and $77 and $79, whereas higher lows can be observed at $67 and $72. The spike on 11 February enabled Litecoin to breach its resistance at $75, following which the token has steadily increased its valuation to $79.86. The pattern suggested that a bearish pullback is inbound for the digital asset, something that may surface over the next week.
According to the VPVR indicator, trading volume has been significantly high at $73 since 13 January. However, a major support remained at $71. A pullback may depreciate Litcoin’s valuation to somewhere between $73 and $71, following which the token may undergo another bullish hike.
The Relative Strength Index or RSI indicated another interesting pattern. It can be observed that the RSI exhibited a decline after the crypto-asset entered the overbought zone. The first breach was noticed on 14 January, which was followed by an increase in selling pressure. A similar trend followed 30 January and a similar trend followed on 11 February. Similar selling pressure may drop according to past trends, triggering a period of correction.
Conclusion
The bullish market momentum may enter a correction phase following a breach of the $75 resistance on the 11th. A drop down to $73-$71 can allow the market to breathe before another surge above $79.