
Troubled times for the seventh-largest cryptocurrency, Litecoin, is not over as the coin appeared to be far from a bullish flip. It was trading at $40.98, at the time of writing. The silver crypto is yet to exhibit a strong bullish momentum.
Litecoin [LTC] Daily Chart:

Source: LTC/USD on TradingView
Despite a minor downward break on 13th April, LTC price candles have maintained an upward trend for roughly 41 days since the March drop, which led to the formation of a rising wedge pattern on the daily chart. This was indicative of a potential bearish breakout once the wedge completes which could drive the coin to revisit its previously breached support points.
Further validating the argument were the daily moving averages. 50 DMA [Pink] was well below the 200 DMA [Purple] following a death cross suffered by Litecoin on 31st March.
Interestingly, the two daily moving averages underwent a rather short-lived golden cross in mid-February. The positive price actions after the crash have so far failed to reduce the gauge which has been diverging.
MACD indicator was in bullish territory. However, signal line had gained traction in the last 24-hours and was hovering close to the MACD line. This could potentially indicate that a bearish crossover could be right around the corner for Litecoin.
Case 1:
The rising wedge pattern formation coupled with the expanding gauge of the daily moving averages and the conflicted MACD indicator indicates bearish pressure that had engulfed the fate of LTC’s price. In this case, if a bearish breakout materializes, the coin could fall close to its support point at the recently visited $30.5-level. If the trend persists, LTC could revisit the December 2018 lows close to $22.7-point.
Case 2:
In the unlikely case of a bullish flip, the coin could be resisted by the 200 DMA at $52.43. A second resistance point for the coin stood firmly at $63.61.
Correlation:
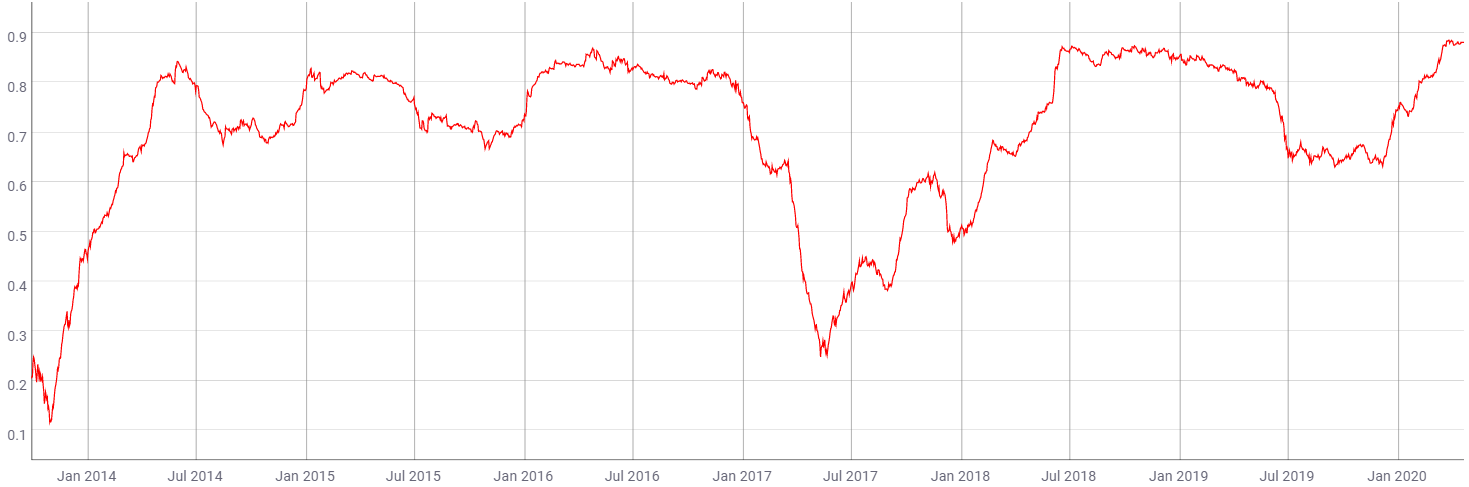
Source: CoinMetrics
The correlation between the price of Bitcoin and the altcoin market has remained strong through the year with the king coin dictating the latter’s price actions. The BTC-LTC correlation coefficient currently stood at $0.88, according to the CoinMetrics chart. A bullish rally for Bitcoin would catapult the LTC market along with other alts for a much-anticipated flip.
Conclusion:
A potential bearish breakout was observed to be in the inkling. This could lead LTC to revisit points at $30.5 and $22.7 while its resistance stood at points $52.4 and $63.6.