Litecoin’s downward breakout could retest $30.3 level

The silver crypto, Litecoin was trading at $41.98. Numerous pullbacks have restricted the coin from breaching the crucial $50-mark. It has fizzled out before securing a strong foothold past this point several times. But as the market recovery continues, will LTC bulls finally make a headway?
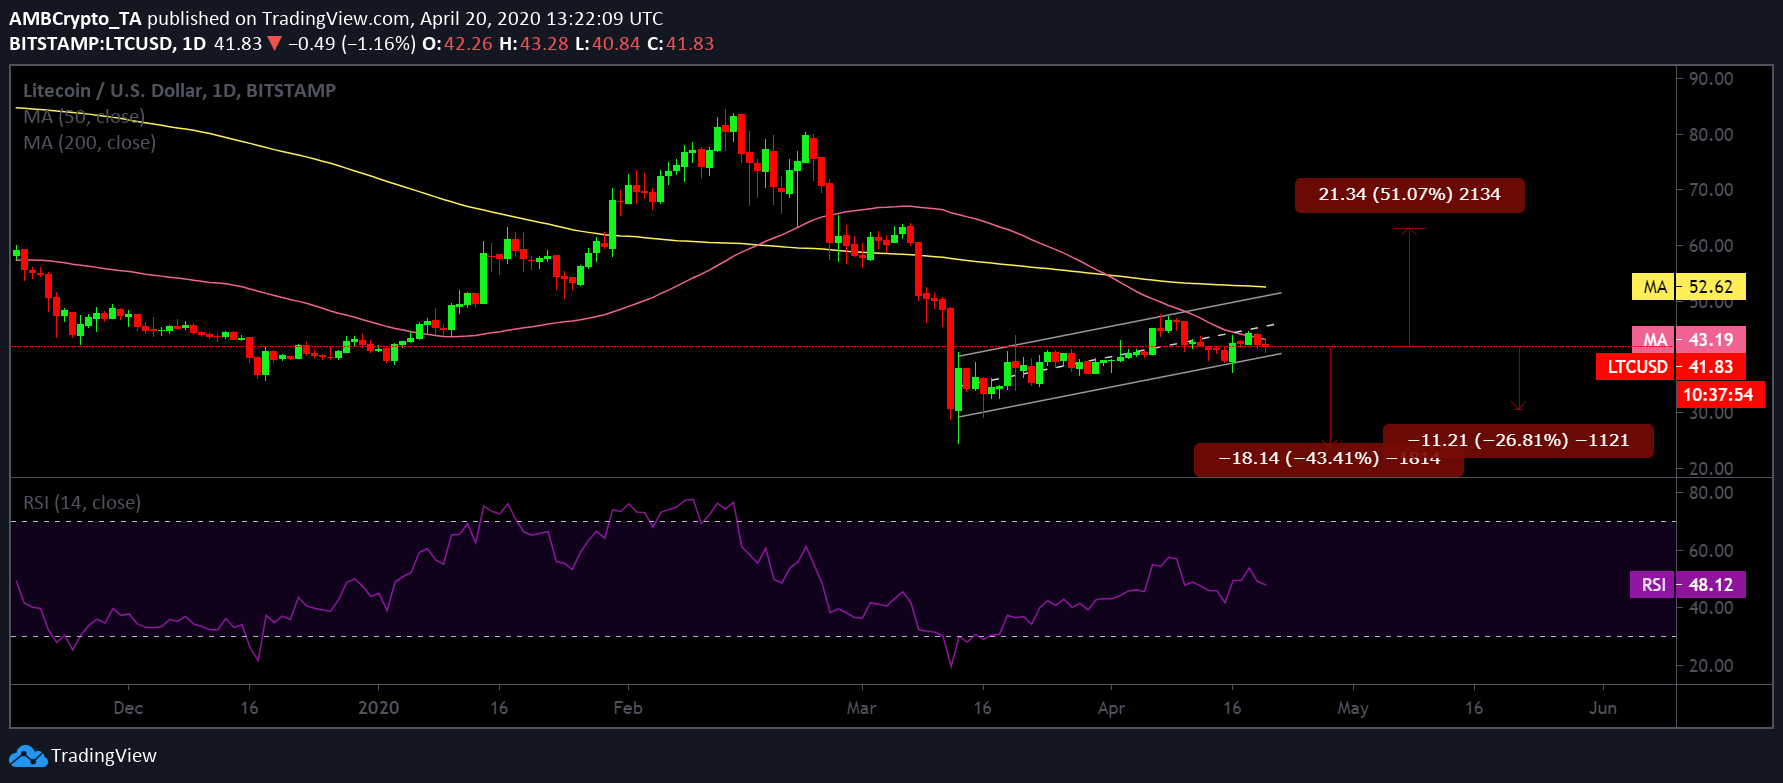
Litecoin Daily Chart:

Source: LTC/USD on TradingView
Litecoin price candles appeared to be oscillating between an ascending channel pattern which was indicative of a steady price rise for the coin right after the devastating crash on 12th March to press time. Following the formation of this pattern, LTC price is likely to break out on the bearish side.
Further validating the bearish argument were the moving averages: 50 daily moving average slid below the 200 daily moving average. Interestingly, LTC suffered a death cross on 31st March, more than two weeks after the crash.
The diverging moving averages further depicted that the bears are here to stay for some time.
Relative Strength Index [RSI] was below the 50-median neutral zone, suggesting a sentiment of a high sell pressure among the LTC investors.
A bearish breakout in the near-term seems inevitable and in this scenario, Litecoin might further breach levels that have been supporting the price candles. If the bearish breakout materializes, the coin could retrace its steps to $30.31 support. A stronger bearish momentum could lead the coin all the way to the December 2017 lows near $23.3. The coin was severely resisted by the 50 daily moving average at $52.83, while another point of resistance stood firm at $63.13.
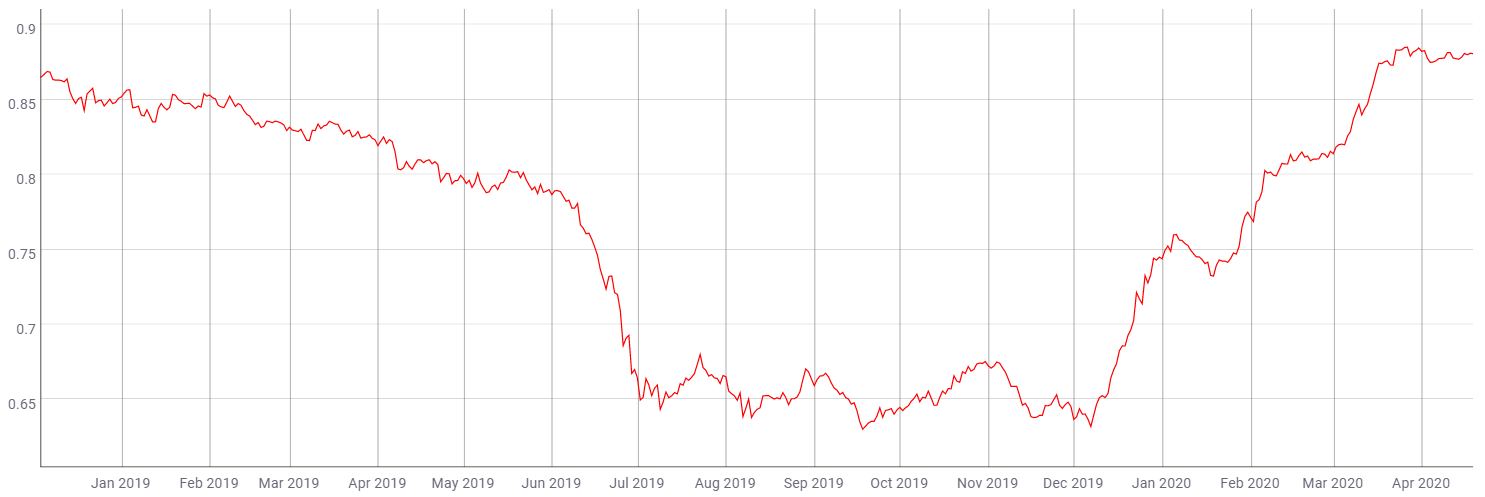
Correlation:

Source: CoinMetrics
LTC has strongly correlated with Bitcoin’s price action. According to CoinMetrics’ chart, the correlation coefficient of BTC-LTC currently stood at $0.88. This evidenced that Litecoin needs a push from Bitcoin to climb higher as its fate remains in bearish territory.
Conclusion:
Fundamentals strongly signal toward a breakout on the negative side, meaning the coin could potentially retrace to support points of $30.31 and $23.13. However, for a highly unlikely scenario of a bullish breakout, the resistance point was observed at $52.83 and $63.13.


