Litecoin’s breach of descending channel suggests trend reversal

Following the fall of Bitcoin on 24 September, there was a major scare about altcoins following suit. And, while the likes of Ethereum and XRP did fall in valuation, they managed to correct themselves and recovered their losses, unlike the largest asset in the industry.
Litecoin was also a target of the bears’ wrath, suffering a decline of over 30 percent. However, it failed to recover its valuation. Bitcoin’s silver counterpart dropped from $75.30 to $50.15 on 24 September and at press time, was valued at $56.06.
1-hour chart

Source: LTC/USD on Trading View
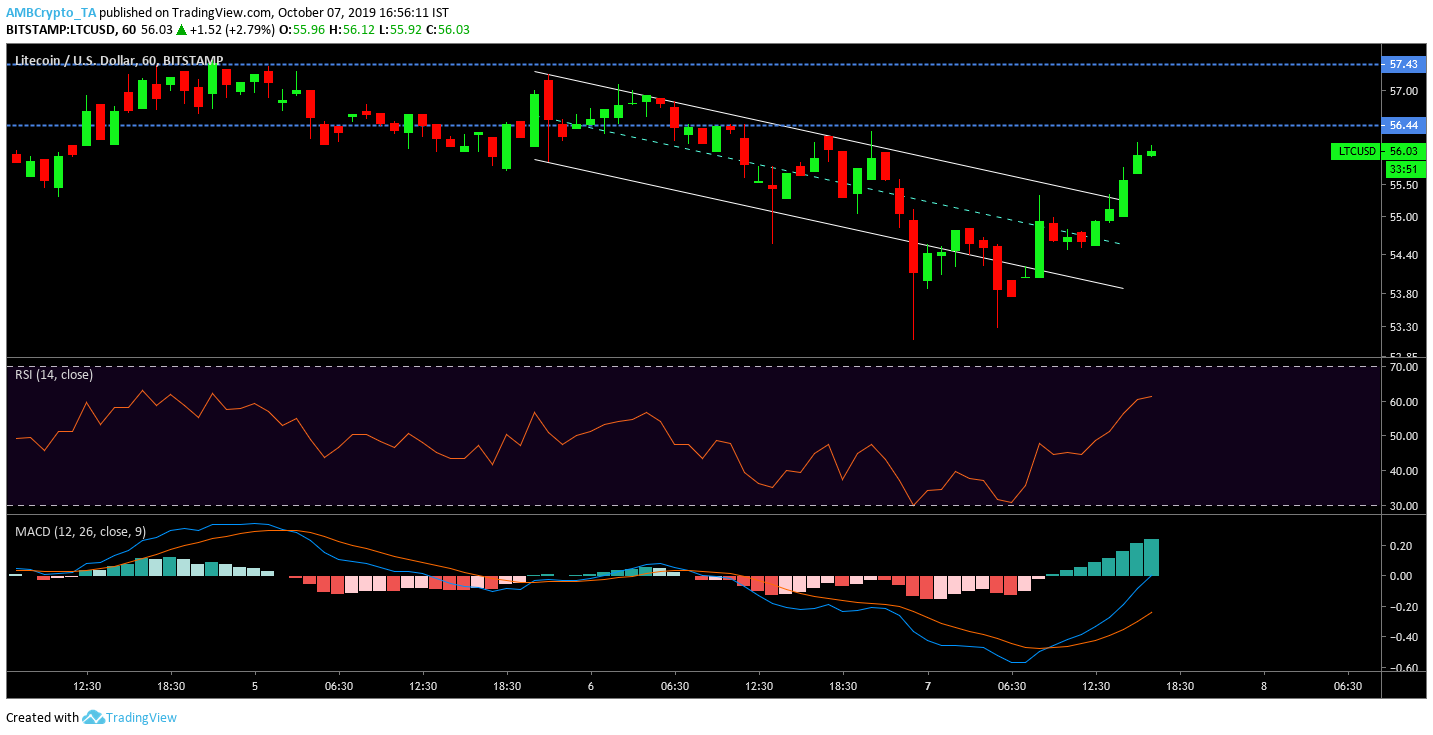
The 1-hour chart for Litecoin pictured a welcoming sight for Litecoin enthusiasts as a bullish pattern appeared to be successfully breached. A descending channel commenced in the late hours of 5 October, resulting in a bullish breakout over the last 12 hours. The immediate resistance for LTC was placed at $56.44, followed by resistance at $57.43. At press time however, the asset lacked significant momentum.
The Relative Strength Index has been indicative of the recent pattern since every time the valuation has dropped to the oversold section, an immediate spike has been recorded, confirming the validity of the present breakout.
The MACD indicator also exhibited a trend reversal in the short-term, siding with the bulls at press time.
12-hour chart

Source: LTC/USD on TradingView
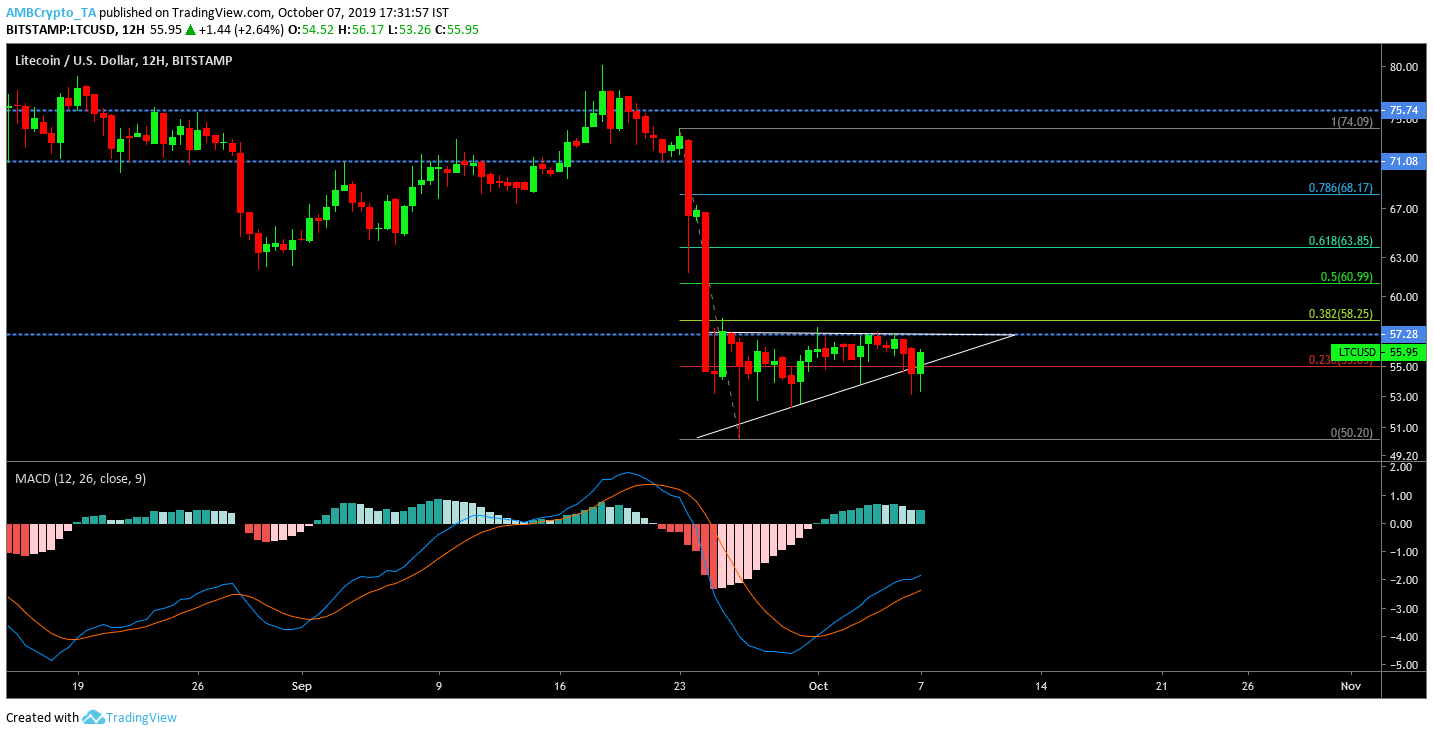
The long-term chart for Litecoin also exhibited significant bullish sentiment. According to the 12-hour chart, a definitive ascending triangle was observed and the price movement of Litecoin adhered to the trend lines. An impending bullish breakout was on the cards in the long-term, as well over the next few days.
Considering a drop of 30 percent was witnessed previously, Fibonacci Retracement lines identified the immediate resistance that needs to be tested by the breakout. The first resistance was placed at $57.28, and the next one was at $58.25. The long-term resistance was drawn at $71.08. The possibility of this resistance being breached is unlikely due to weak price momentum, at press time.
The MACD indicator also turned bullish on the charts.
The market for alts was in recovery mode at the moment. However, until significant resistance is breached, it would be difficult to analyze the current trend. Litecoin is heading in the right direction, but definitive surges are crucial to defining the market sentiment.


