
2020 is off to a great start, with cryptocurrencies recording largely positive gains over the last few days. Since 3 January, the total market cap of cryptocurrencies has risen by 7% from $185 billion to $198 billion. Litecoin rose by nearly 1.8% in the last 24 hours alone. However, its prospects for the future seem less optimistic than its performance in the near past.
At press time, Litecoin was valued at $43.42 with a 24-hour trading volume of $2.85 billion.
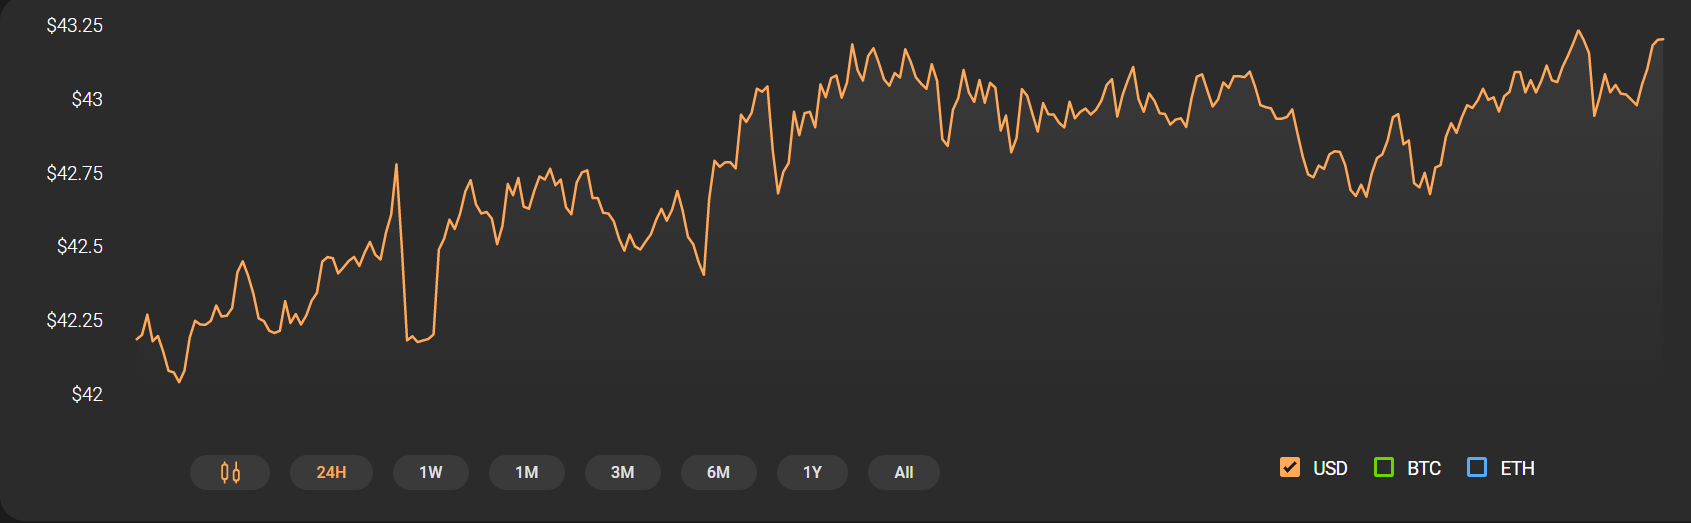
Source: Coinstats
Litecoin 1-hour chart
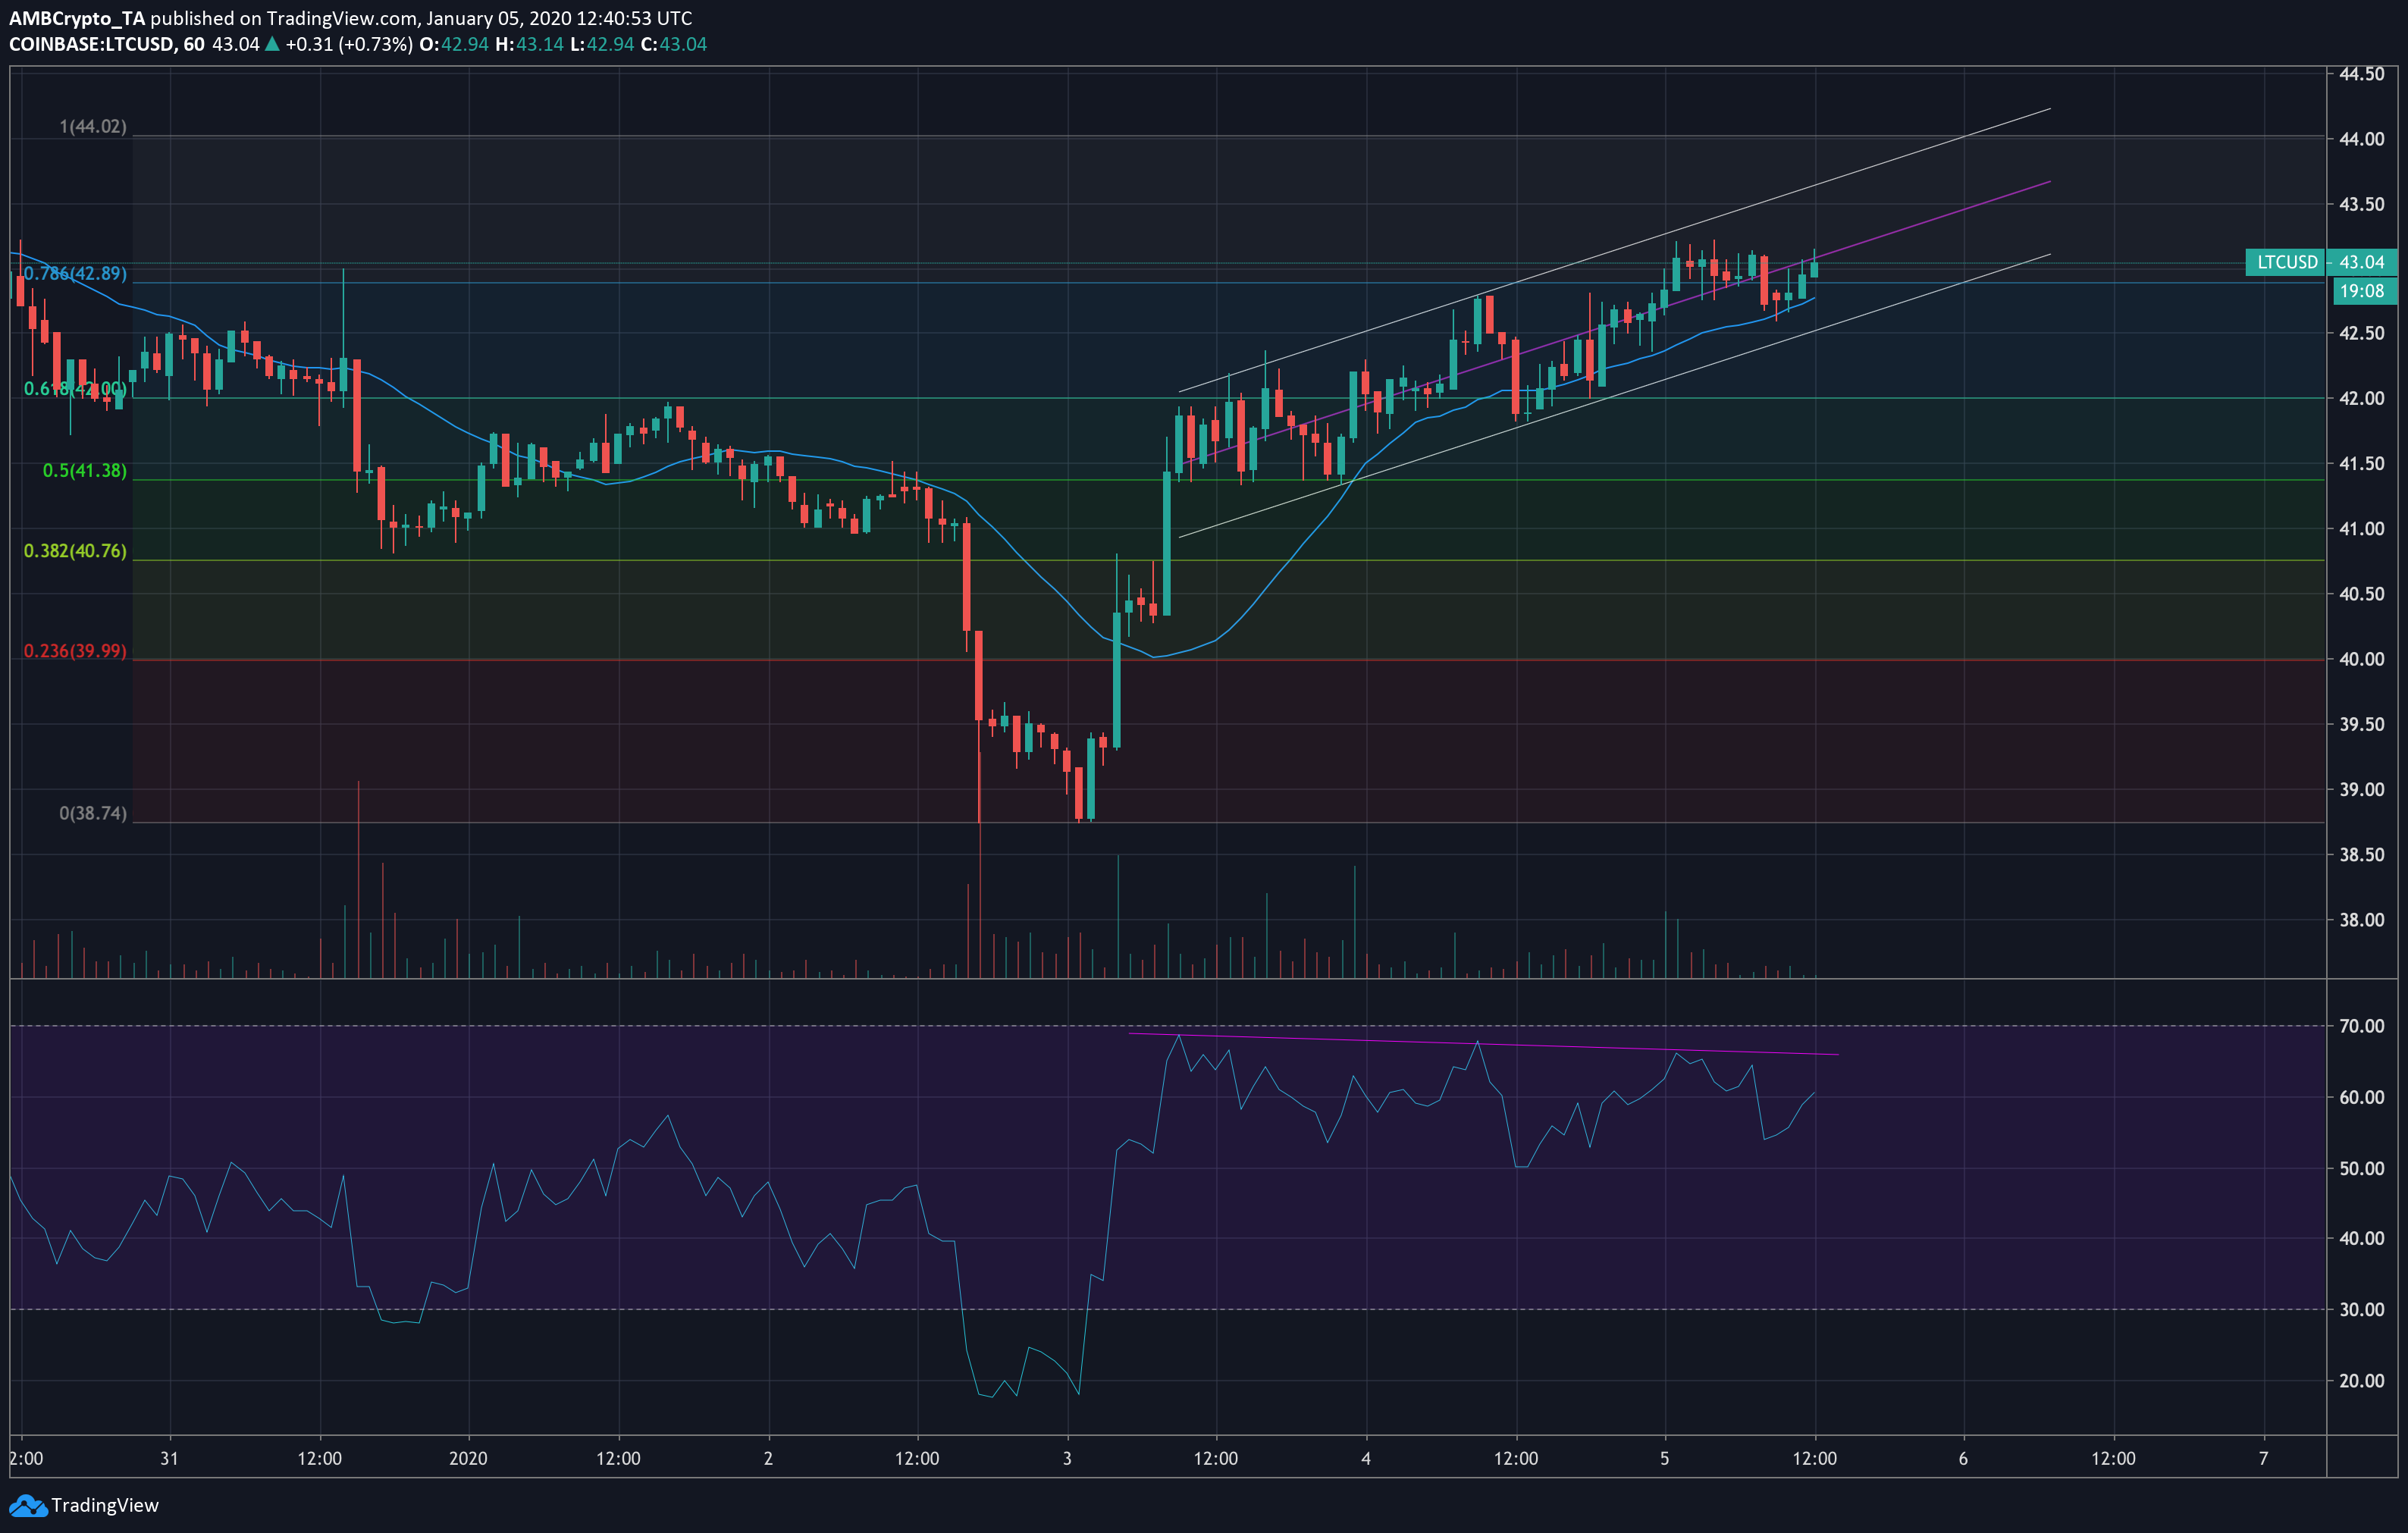
Source: LTC/USD on TradingView
The 1-hour chart for Litecoin showed considerable recovery of value, rising by almost 11.5% in just over two days, a development that followed LTC’s colossal ~7% drop on 2 January. It was found that LTC entered an ascending channel formation soon after the drop, with accompanying decreasing trend in volume and intermittent spikes as the price approached the pattern boundary, further confirming the pattern.
The 21-hour moving average was seen moving under the latest price candle, painting a traditionally bullish scenario for Litecoin in the short-term. However, ascending channels tend to cause a trend reversal which, in this case, would have LTC break downwards.
Further, the Relative Strength Index (RSI) was seen creating lower highs over the duration of the pattern, contrary to what was presented by LTC’s rise in value over the last few days. This created a situation called ‘bearish divergence,’ and this could signal a drop in price in the near future.
Litecoin On Balance Volume
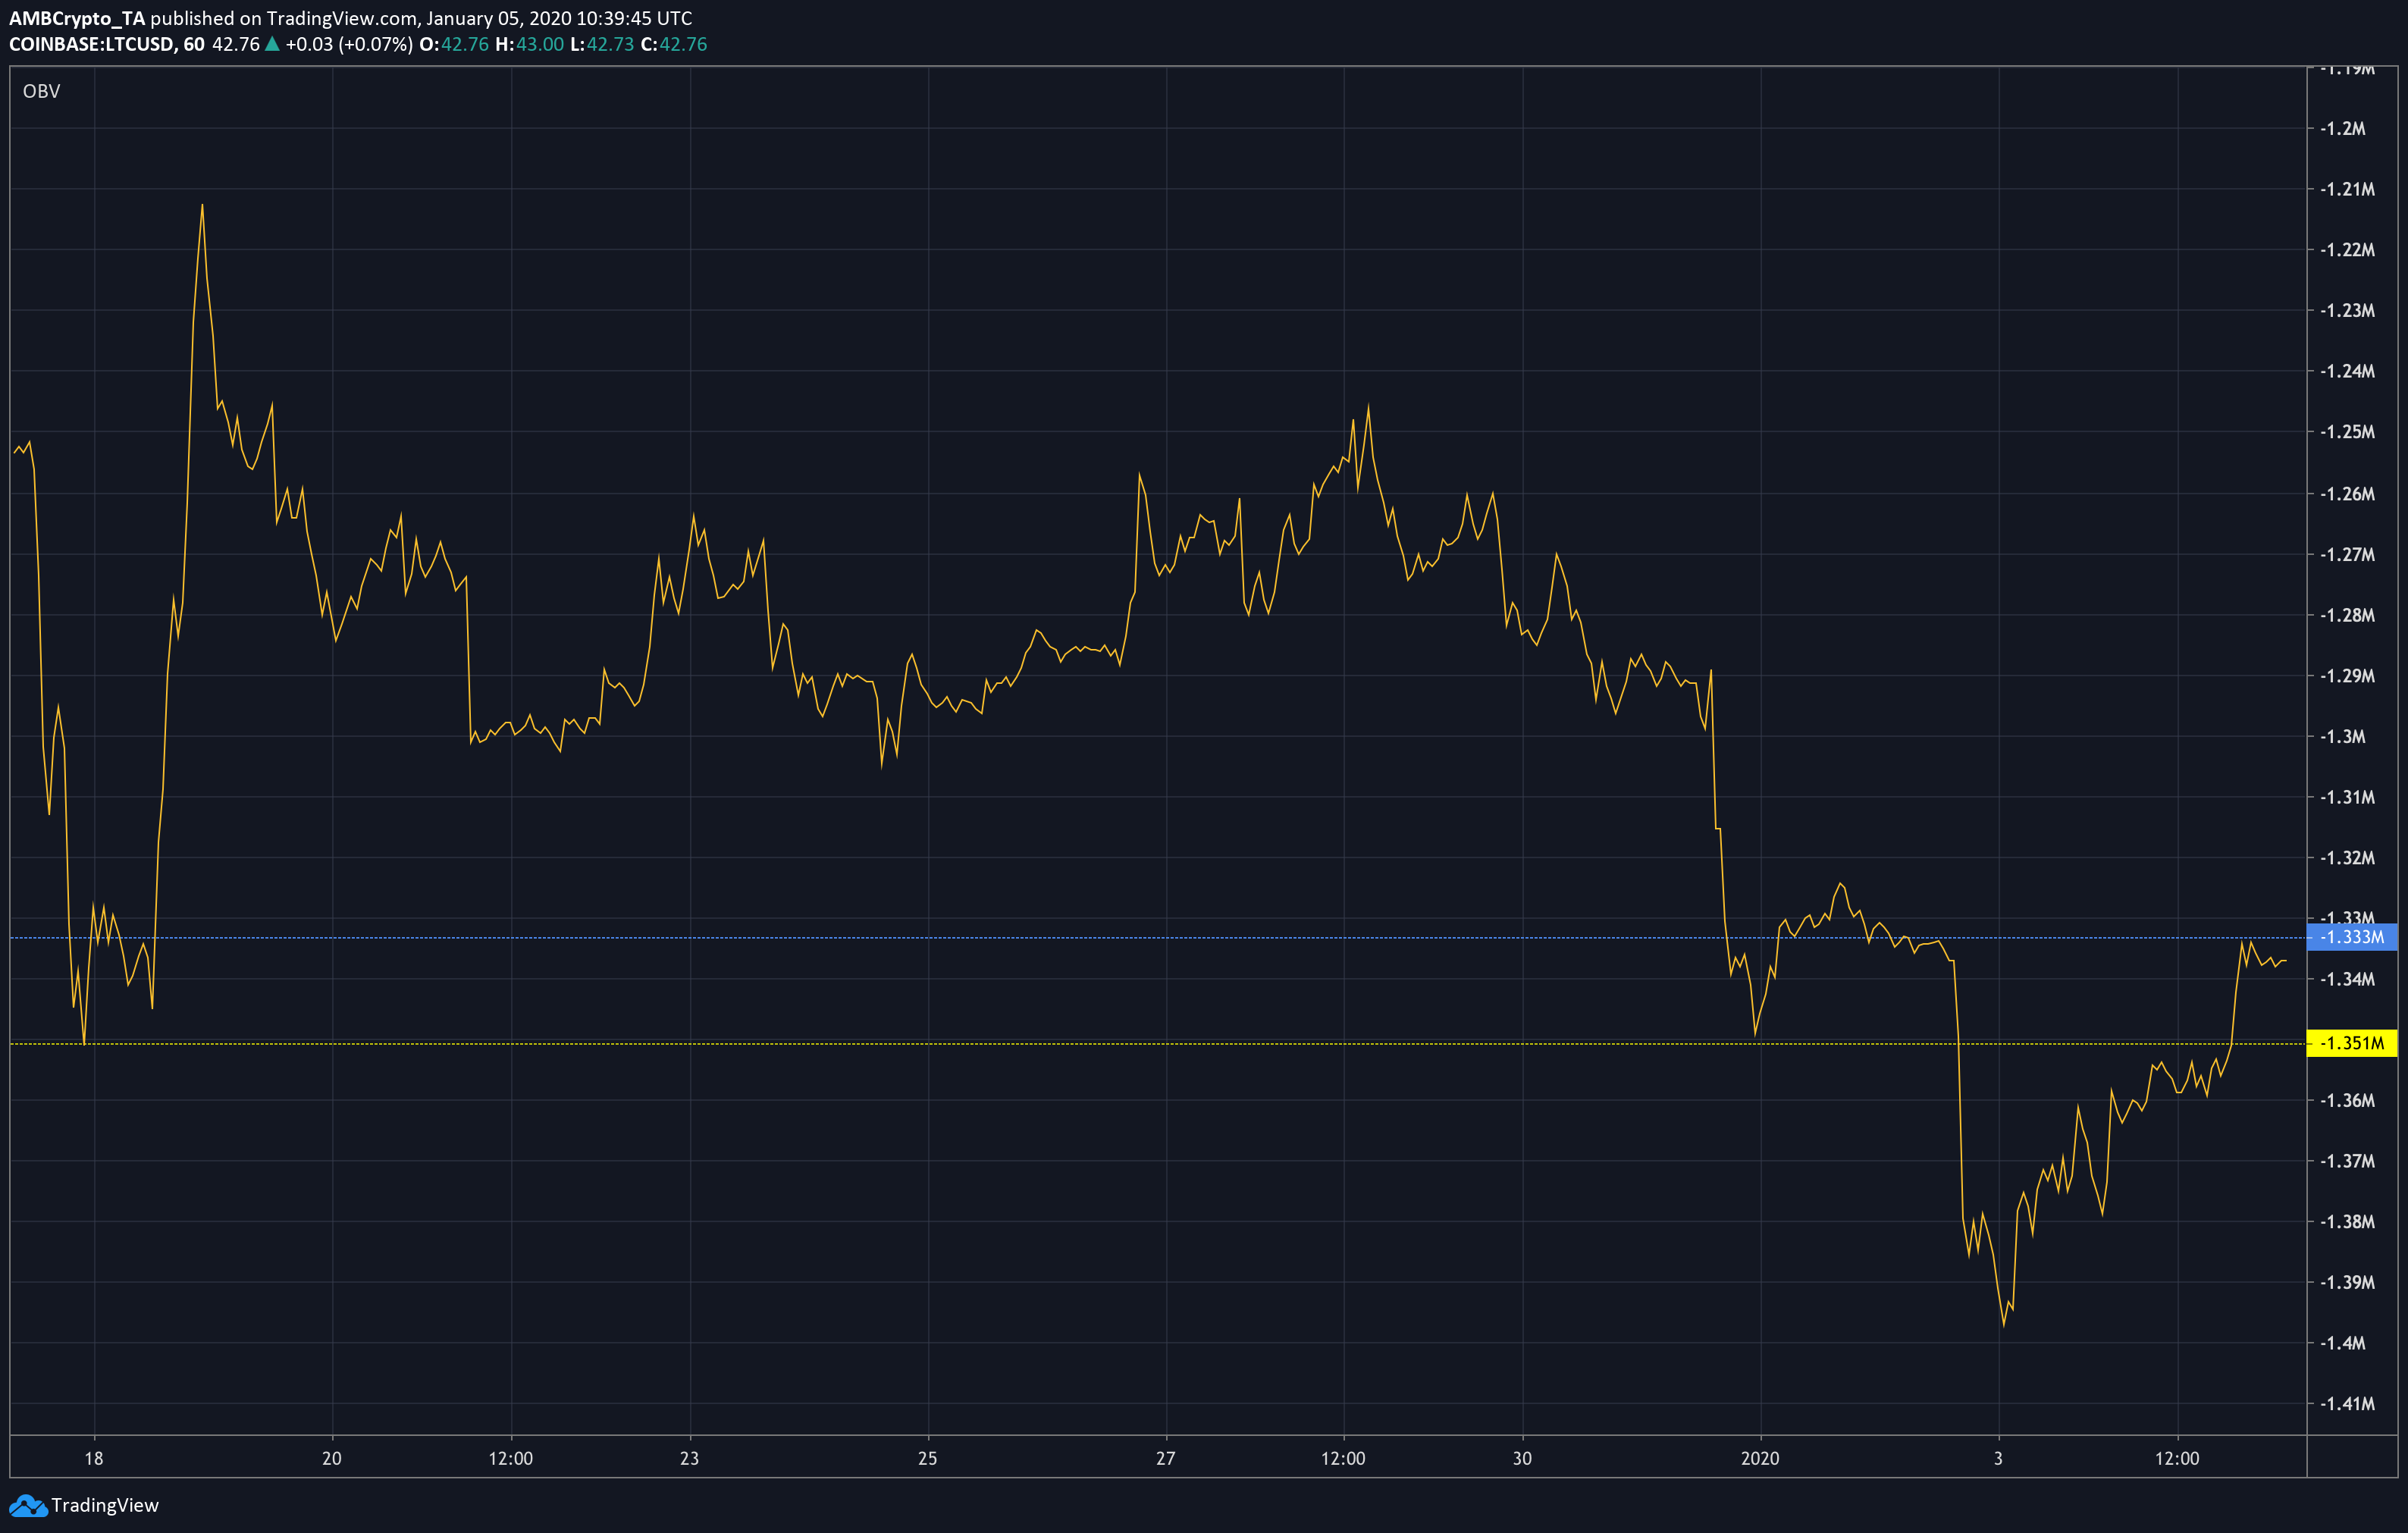
Source: LTC/USD on TradingView
Despite relatively bullish signals in the attached chart, a look at the On Balance Volume indicator which measures buy and sell pressure as a cumulative index, showed that it hit a resistance level at the -1.333M mark. The indicator could possibly dip down to the -1.351M mark in the coming days, a development that could indicate a short-term drop in Litecoin’s price through the assumption that price follows cumulative volume.
This means that even after a rise to the upper trend line at around $43.70, a downward breakout could still take place, pushing LTC down to the 50% Fibonacci retracement line at $41.30. This would likely follow some slow sideways movement, until the price reaches the breakout point.
Litecoin Active Addresses
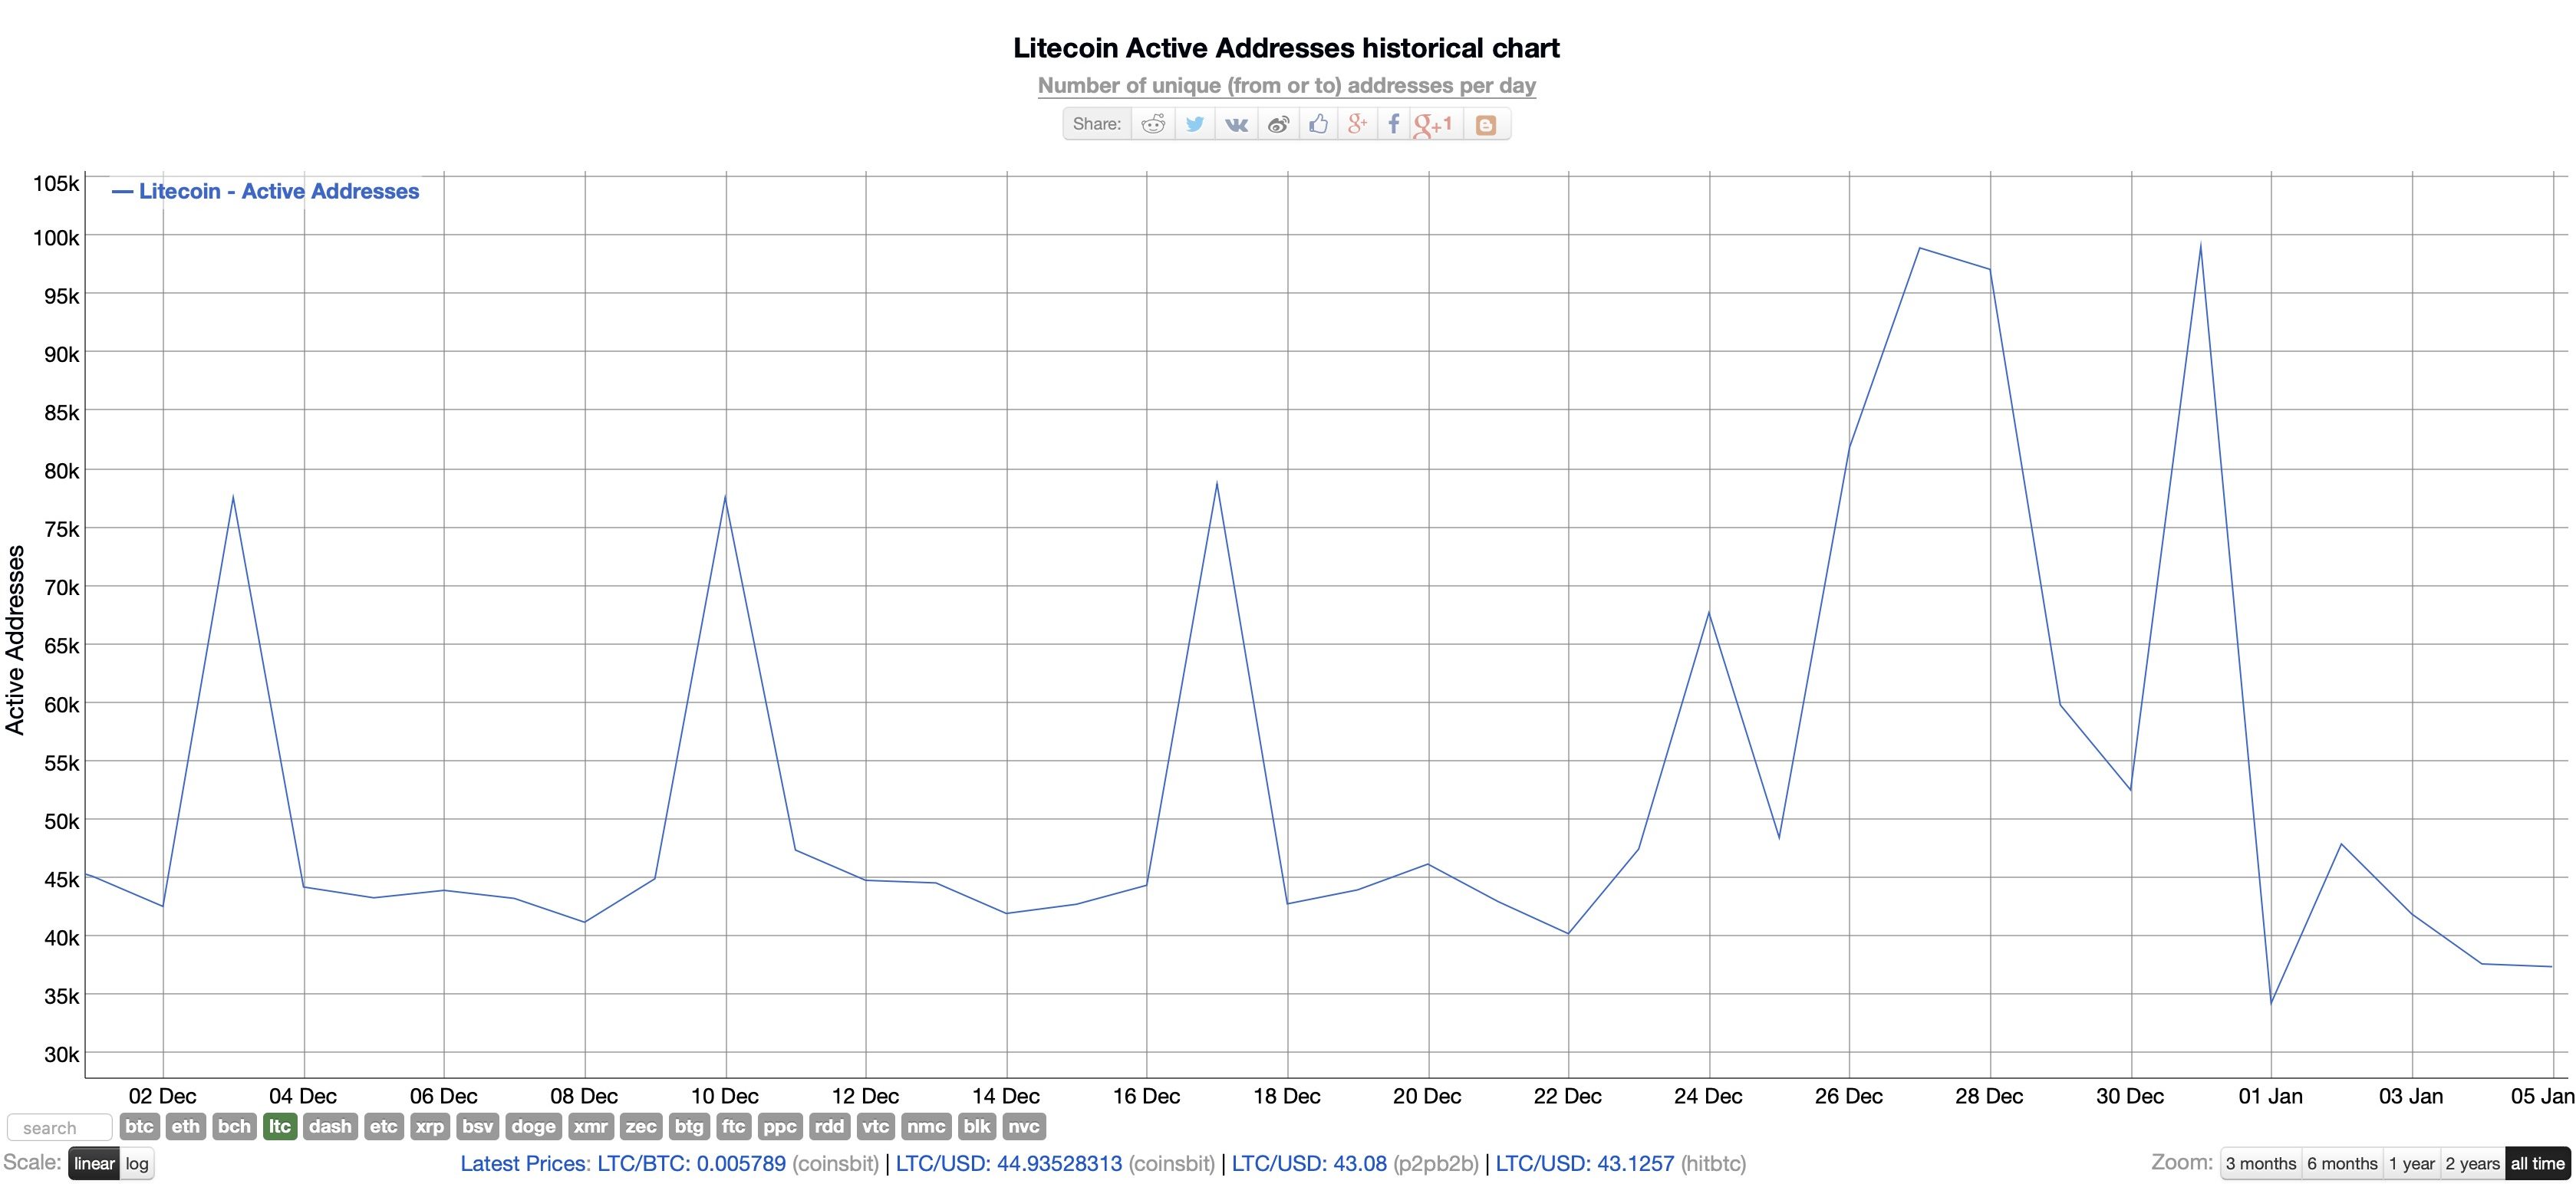
Source: BitInfoCharts
Ignoring the weekly spikes over the last few months, BitInfoCharts showed that the active addresses on Litecoin are currently seeing their lowest numbers since mid-2017, the period before the coin was spurred into a bull run. While the effects of active addresses on price movement are arguably speculative, low activity on the network could lead to a further dip in LTC’s value as a low number of active addresses could imply lower demand.
Conclusion
All signs seem to suggest that LTC will rise to $43.7 in the next day or so, followed by a bounce-back into the pattern, where it could find support on the ascending channel mid-line. The price could move sideways for a time here, before dropping further and breaking downwards to the $41.30 mark in the next couple of days.