
Litecoin, the fifth largest cryptocurrency on the market is looking weak. A long bearish stint has posited the coin below the key psychological level of $70, and as current trends point, digital silver looks to stay below that mark.
Short Term:
Source: Trading View
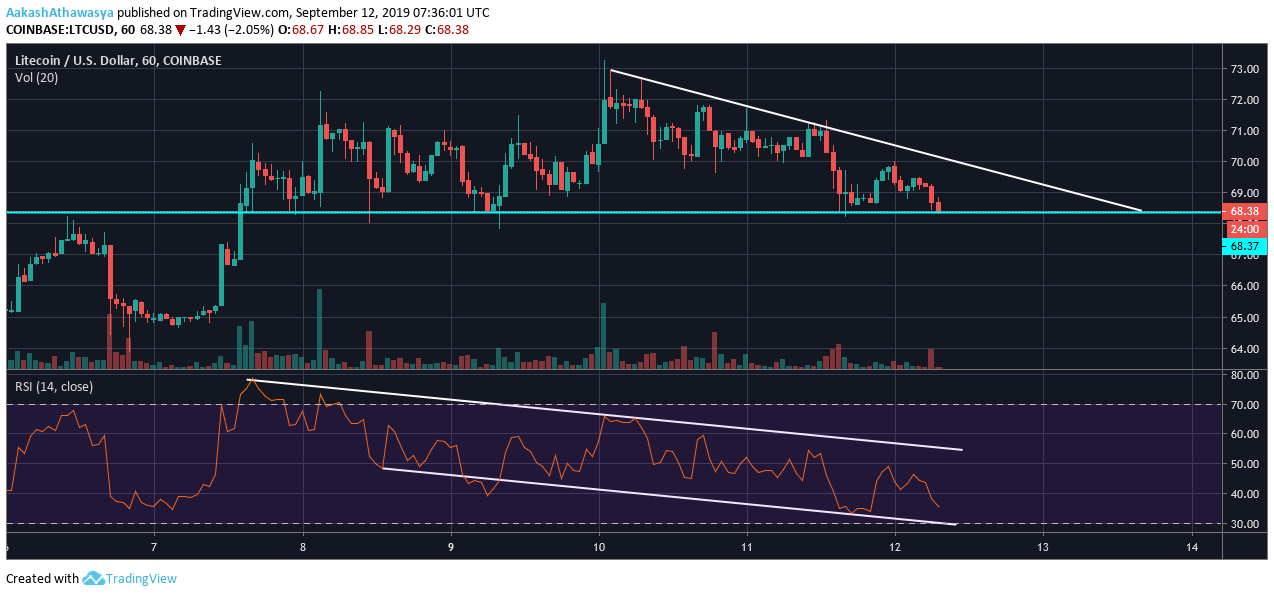
Looking at the one-hour chart, there exists a clear formation of a descending triangle as the price continues to slump. To evidence the same, lower highs can be pointed at $72.8, $71.1 and $70, while the base of the triangle is placed at $68.37. The base has been acting as make-shift support, in the hourly chart, since the close of the previous week.
After a consistent price struggle, Litecoin showed signs of life on September 7 rising by a massive 8 percent in the day, as the price briefly broke the $70 mark for the first time since the beginning of the month. However, Litecoin has not managed to sustain its stint over $70. On the two occasions, it broke the $70 ceiling (on 3rd September and 7 September respectively), a slump below the mark was seen less than 24 hours later.
To add onto the same, since the price last broke $70, RSI has been on a downtrend. At press time, investor interest sits at 35.52, a far cry from the September 7 high of 78.55, well into the ‘overbought,’ zone. It should be noted that the price push to $71, seen on September 8, manifested without a significant increase in the RSI. A formation of a descending parallel channel is quite clear on the key indicator.
Long Term:
Source: Trading View
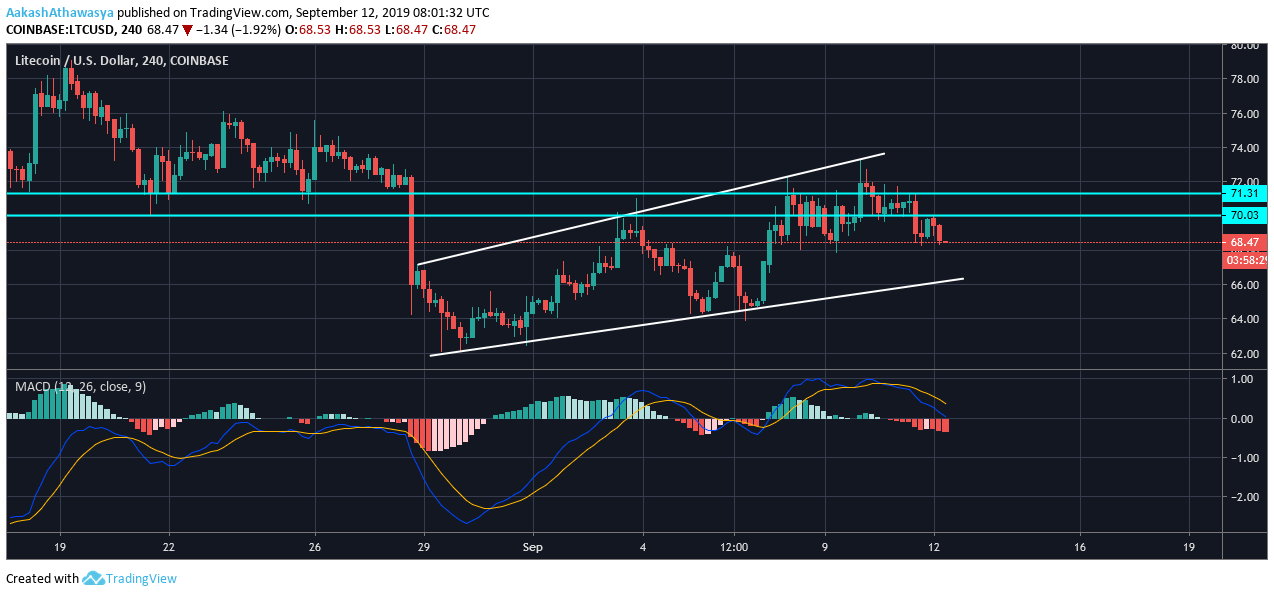
Zooming out, we see some optimistic signs. An upwards shifting parallel channel looks to form, although it is firmly stemmed in the 8.71 percent drop that was seen during the close of August. The parallel channel is punctuated with higher highs, seen at $65.92, $69.88 and the recent high of $73.25 which the coin soon fell below.
If the parallel channel looks to continue, next level that should be looked at with anticipation is $70, followed by $71.31, which is now acting as the support-flipped-resistance. At press time, digital silver is trudging just below the aforementioned level, while the MACD is pointing to a downward movement.
On charting the 1-hour and 4-hour price movement of Litecoin, the descending triangle takes precedence over the parallel channel. If the price breaks-out of the triangle, and then makes a move above the $70 mark, it will find major resistance around $71.2. However, if this materializes, the upwards parallel channel will continue, leading to a sustaining green market for LTC. Throw in the poorly performing RSI and MACD, and a slumping collective market, Litecoin’s push above $70 does not look likely.
![Reasons why Litecoin [LTC] investors should be concerned](https://eng.ambcrypto.com/wp-content/uploads/2023/12/ambcrypto_A_Litecoin-themed_scen-400x240.png)