Analysis

Litecoin testing descending triangle resistance; failure to break could prove costly
Posted:

Another key test for Litecoin awaits.
It seems like every time we look at Litecoin charts, another key level is being tested, and going by recent charts, every test has been a failure. Since reaching its peak of $144 back in June, digital silver has been in a steep descent owing to the hype of its August halving not manifesting and a stagnant cryptocurrency market, which last week suffered yet another blow.
For the better part of 2019, Litecoin was significantly outperforming the market, but over the past few months, the market, despite its dismal movements has held its own while Litecoin was stuck in a parallel downward channel.
SHORT TERM:
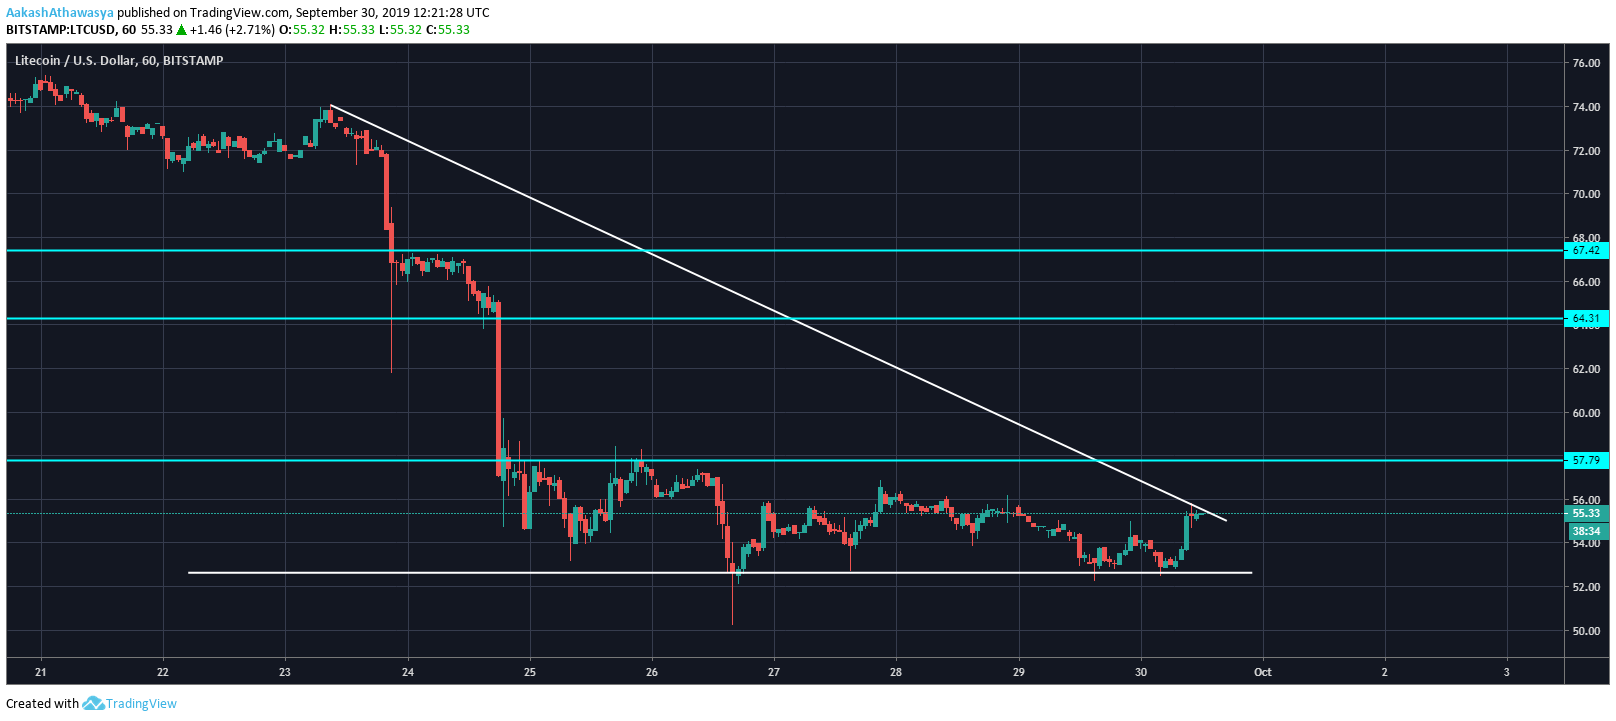
Source: TradingView
Before we look at the parallel channel, short term 1-hour chart has more concerning news. Over the past week, Litecoin has fallen through support after support, shaving over 22 percent of its value, leading to formation of a descending triangle. The left peak of the same is placed at $73, which the coin was trading at on 23 September, on the event of the Bakkt launch. The base of the triangle is at $52.64, which digital silver bounced off of on 26, 27 and 30 September.
With the prices sliding down, the closet test for the support of the triangle was on Sunday, 30 of September when Litecoin saw an almost 5 percent price gain in 3 hours. However, the same was stalled, but it does point to the slumping support of $54- $55 being tested in the next few days, and if other technicals hold the coin will break out.
It should be noted that most descending triangles result in a price move downward on breakage, as happened with Bitcoin last week, which shaved over $2,000.
ZOOMING OUT:

Source: TradingView
The downward channel for Litecoin has been persisting since mid-August, with one sole effort to break out on 18 September, which did not succeed. Last week’s price drop planted LTC in the thick of the channel, with the latest indications placing it in the lower chasms of the same.
Based on the chart, the resistance level of $62 will cause problems for the coin, after it breaks out of the price range of $53 – $58, which does not look likely for the coin. The only solace for LTC proponents is the resurging Relative Strenght Index [RSI] which has been moving upwards lately. Since tapping out at a dismal 13.1, RSI has been gaining ground, moving up to 48.35 at press time.
FINAL WORD:
Litecoin is facing yet another test, both in the 1-hour and the 4-hour chart. The former’s descending triangle will look to persist, and if so, another price movement downward will be likely, but it the same is broken, the range of $53 – $58 will be broken. The lower end of the range also should hold for the price of Litecoin not to slump past $50 and result in a complete breakdown.