
Weeks after breaking into its Death Cross, Litecoin is looking more bearish than ever. The fifth-largest cryptocurrency on the market is trudging downward yet again, looking to sustain below the $70 range after breaking above for a brief period earlier this month.
Short Term:
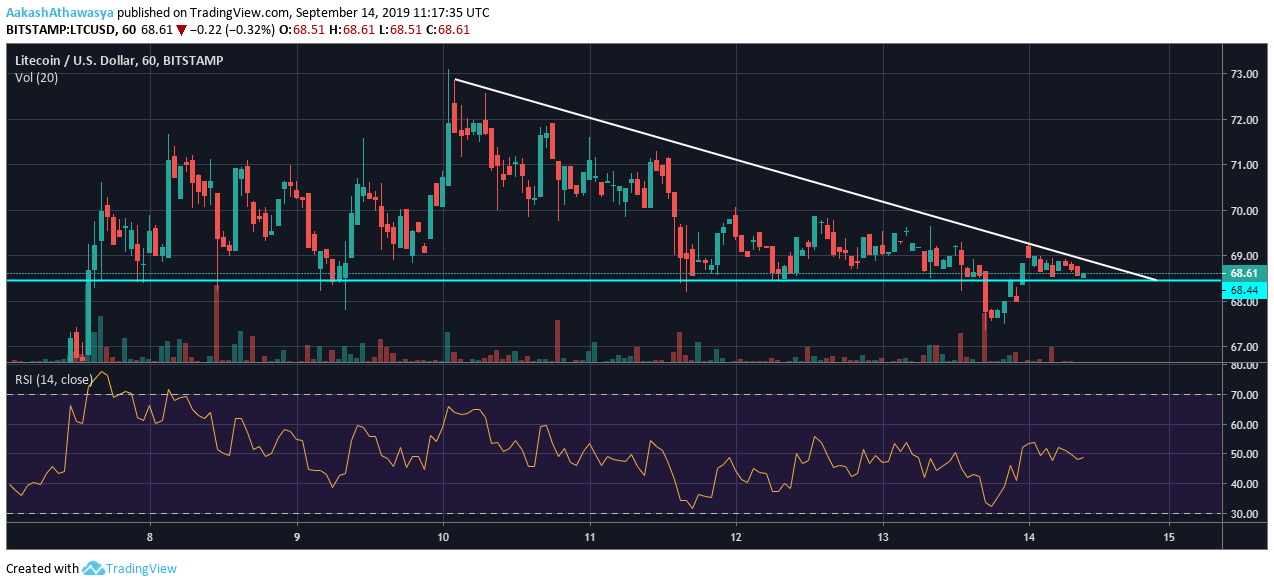
Source: Trading View
In terms of the short term 1-hour chart, LTC bears are periodically drawing the price down forming a descending triangle. With lower highs placed at $72.32, $71.89, and 68.96, while the base has been laid out as the support level of $68.44 which the current price is struggling to stay above.
Litecoin dipped below the aforementioned base on 1600 UTC on 13 September, which was seen as the slump that could propel a major collapse. However, despite a 2 percent dip in 3 hours, the price managed to climb back up over the $68.44 base by 2300 UTC on the same day. The recovery was short lived as the top of the triangle acted as yet another resistance which the price bounced off. At press time, candlesticks are veering toward the end of the triangle, signalling either a breakout over the declining resistance or a fall below.
To accompany a positive move out of the triangle, volume will have to assist LTC. The cryptocurrency’s volume as well as Relative Strength Index [RSI] is not holding up well, Still locked at 48.55 and moving in a parallel channel, a move out looks unlikely.
Long Term:
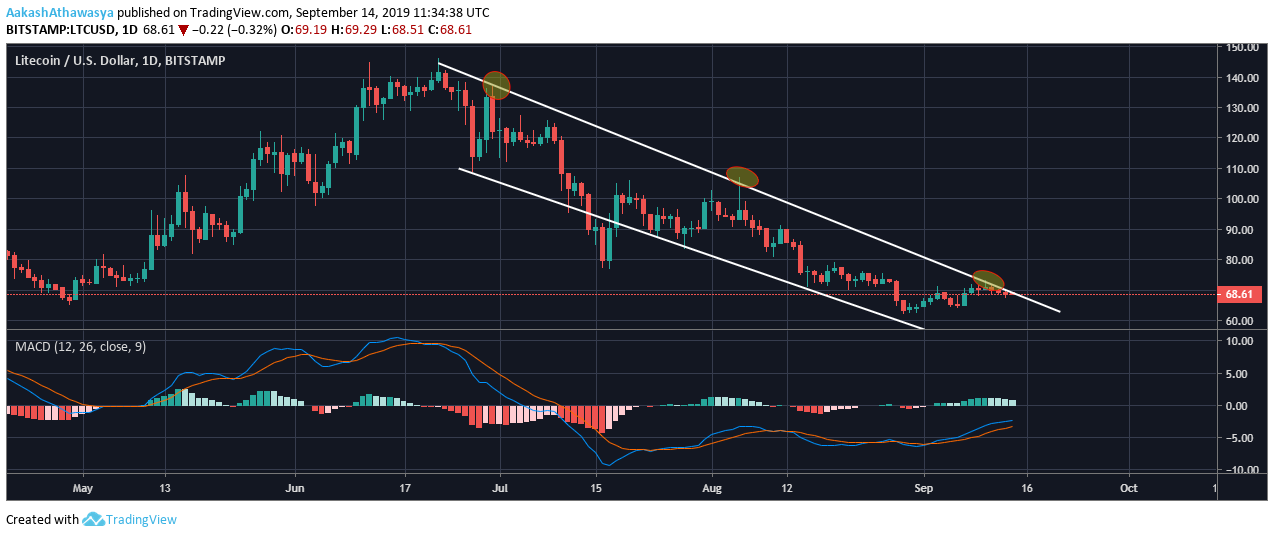
Source: Trading View
Looking at the wider picture, Litecoin continued to languish within the downward parallel channel. Beginning in June, the four-month old channel was initiated when Litecoin was at its 2019 peak of over $144. Since then, the price of the coin has dropped by over 52 percent, with each decline encapsulated in the channel.
On three occasions, the coin tried to break out of this channel, however, each time the price dropped, and the same was accompanied by a more severe decline. Lower high as littered in the channel, placed periodically at $137.41, $106.41, $89.92, and several within the $70 – $80 range.
The only positive sign for Litecoin is the fact that owing to the massive [relative] price burst seen on 7 September, which added 6.24 percent to Litecoin’s price, the coin is now testing the slanted resistance. If the price does not fall below $68 prior to the close of this weekend, Litecoin will escape the parallel channel.
On the trading health front, MACD indicator pointed to an overtake, and a good one at that, of the MACD line against the Signal line. If the same does hold, a move out could be more than likely, signalling a clawback for Litecoin.
![Reasons why Litecoin [LTC] investors should be concerned](https://eng.ambcrypto.com/wp-content/uploads/2023/12/ambcrypto_A_Litecoin-themed_scen-400x240.png)