Litecoin short-term Price Analysis: 21 June

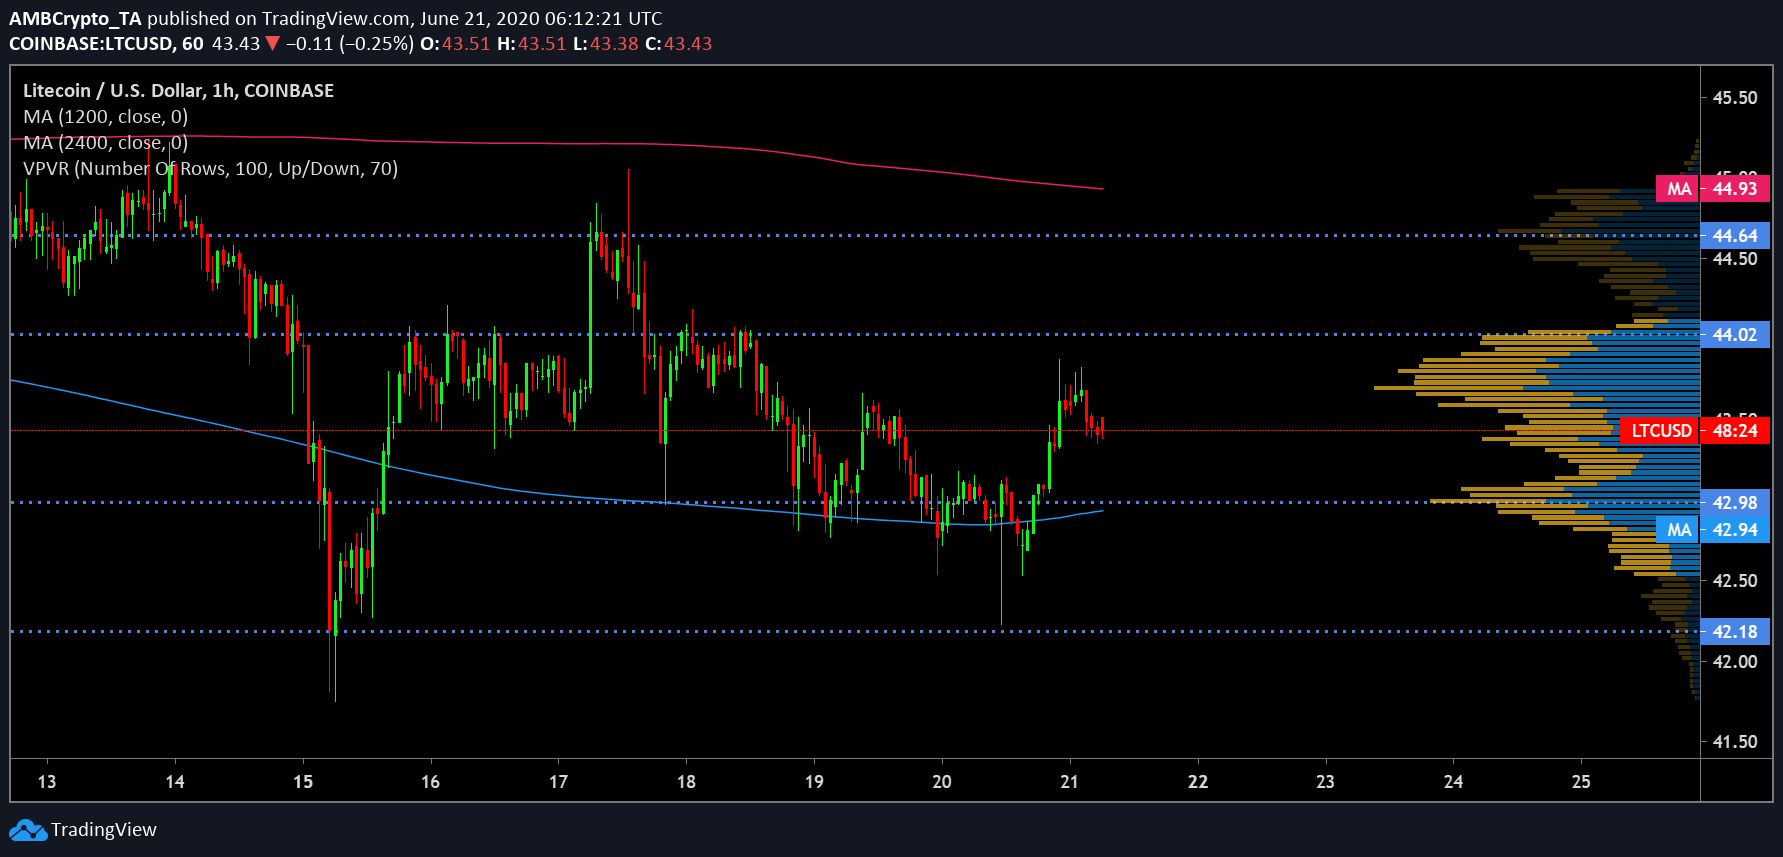
Litecoin was being traded at $43.47, at the time of writing, after a minor surge of 0.74% over the last 24-hours. While the silver crypto maintained a consistent upward trend since the crash back in March, following the recent correction, the coin suffered major falls; multiple attempts to break above the crucial $45 have not been successful. Looking at the charts below, Litecoin’s price could potentially consolidate in the current range for some time.
Litecoin Hourly Chart:
Source: LTC/USD on TradingView
After falling close to $41-level, Litecoin jumped back up after regaining a much-needed upside break. However, its price appeared to have stuttered below $45. Daily moving average aligned with the bulls. 50 DMA [Pink] was well above 100 DMA [Blue]. While 50 DMA has been resisting an upward price breakout, 100 DMA, on the other hand, has formed critical support from the coin preventing any further downward trend for LTC price candles.
In addition, VPVR indicated a high trading activity in the current price level depicting a phase of consolidation before any breakout patterns emerge.
Source: LTC/USD on TradingView
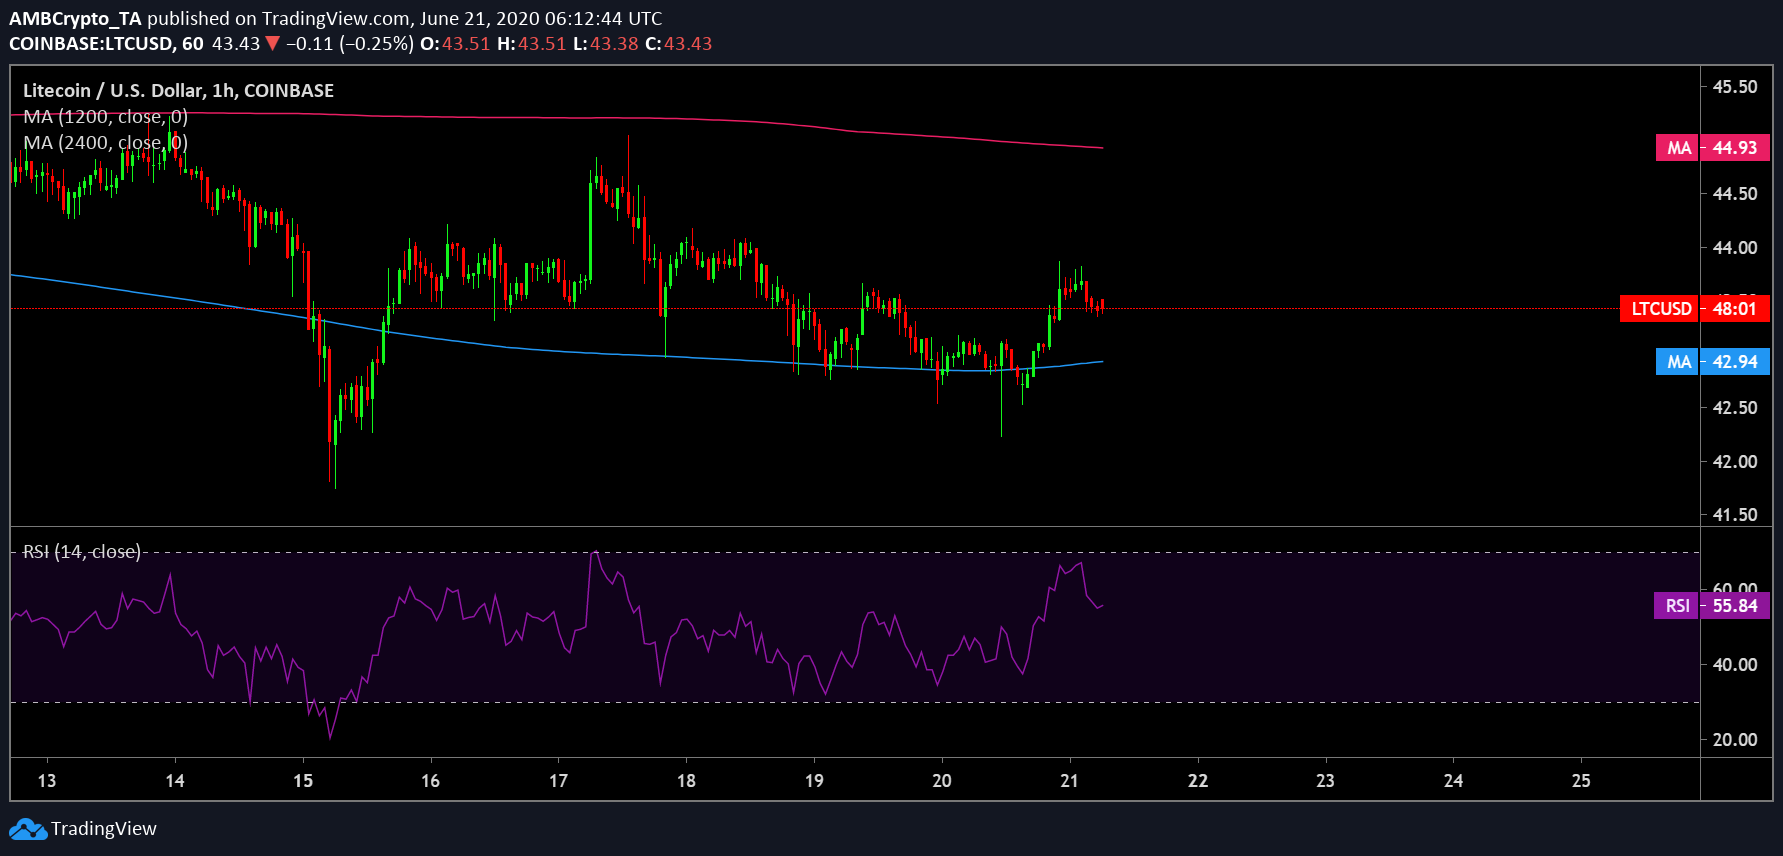
RSI was above the 50-median line, however, it was declining. If this continues, RSI could potentially drop close to 50 and find support near this region.
Correlation:
Source: Coin Metrics
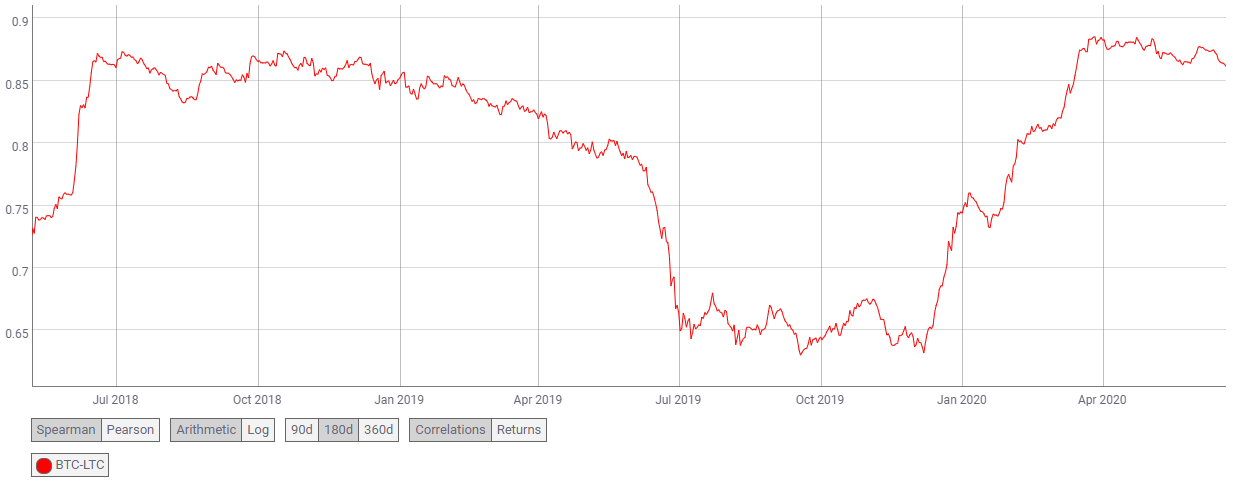
The silver crypto has closely mimicked Bitcoin’s price movements and the recent dips and minor surges were indicative of this. BTC-LTC correlation coefficient stood at 0.86; if the king coin manages to break through the currently stagnant price level, it could essentially propel Litecoin to follow suit.
Conclusion:
The above charts depicted a consolidation phase for the coin below $45 in the next 24-hours. However, RSI depicted a buying pressure despite inaction on the price side. If this materializes, LTC may climb to $44.02 and if the trend further gets necessary momentum, it could target subsequent resistance points at $44.64 and $44.93 as it was supported at $42.94 level close to the 100 DMA as well as at $42.18.

