Altcoins

Litecoin price could retest $30-level as moving average’s gauge expands
Posted:
| Last updated: February 23rd, 2024

All is not well for the seventh-largest cryptocurrency, Litecoin, it has not been good for quite some time now. Soon after its scheduled block reward halving, LTC underwent a downward spiral. Desperate attempts have failed to push the coin to breach significant resistance points.
The silver crypto was trading in a consolidation phase before the bears made a return and it looks like they are here to stay.
Litecoin Daily Chart:
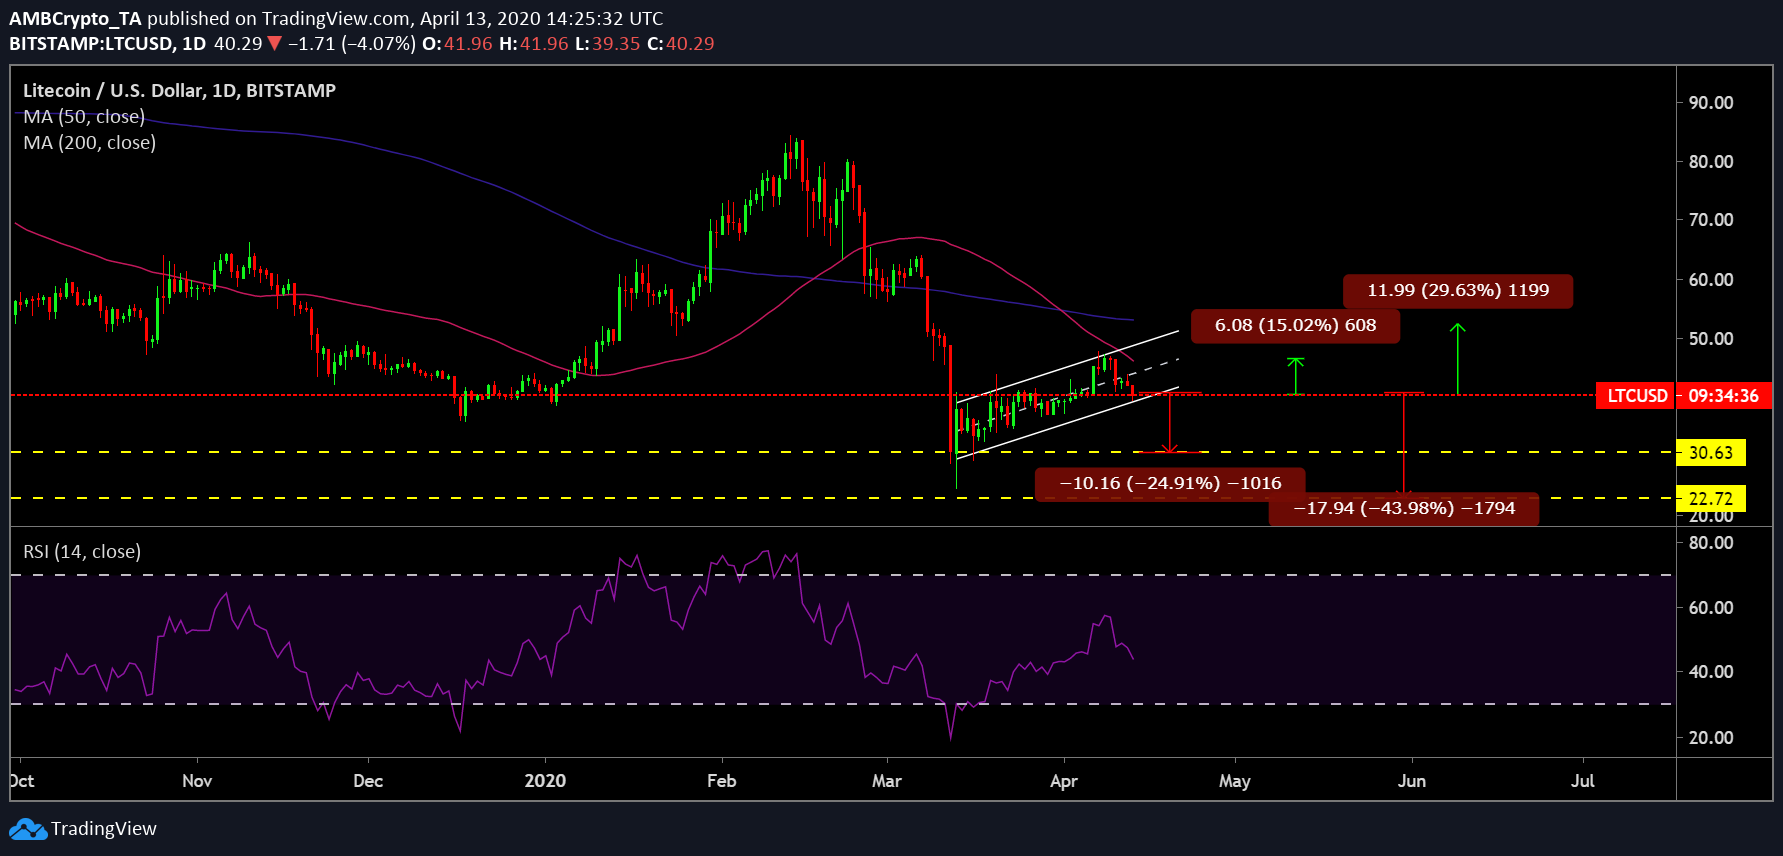
Source: LTC/USD on TradingView
The formation of the ascending channel pattern on the daily LTC chart was indicative of a potential bearish breakout in the near term. LTC price candles were found to be oscillating between trendlines of this pattern since 13th March. The moving averages also depicted a bearish picture for the coin.
The moving averages sustained a death cross on 31st March following which the 50 daily moving average slid below the 200 daily moving average and the gauge has been on an expansion ever since. This was indicative of a potential breakout to the negative side in the coming days.
Interestingly, just a few weeks before the death cross, the moving averages underwent a golden cross which was rather short-lived as it succumbed to the bearish pressure stimulated by the flash crash.
Relative Strength Index [RSI] also aligned with the bears. It tumbled down towards the oversold region, after a brief tryst above the 50-median, indicating a rising sentiment of high sell-pressure in the LTC market.
Case 1: Bears taking the lead
The case for bearish breakout appears to be imminent which is supported by the ascending channel pattern formation, the expanding gauge of the moving averages after a death cross and RSI indicator falling back below the 50-median. If this materializes, Litecoin’s price could be tested at $30.63, which happens to be the 2020-low for the coin. If the bearish trend persists, the silver crypto could find itself near the December 2018-lows close to the $22.72-point.
Case 2: If bulls make a headway
In a highly unlikely scenario of the bulls breaking out, the resistance points for LTC stands tall at points $46.78 and $52.48, where the 50 and the 200 daily moving averages, respectively, seemed to be resisting the price candles.
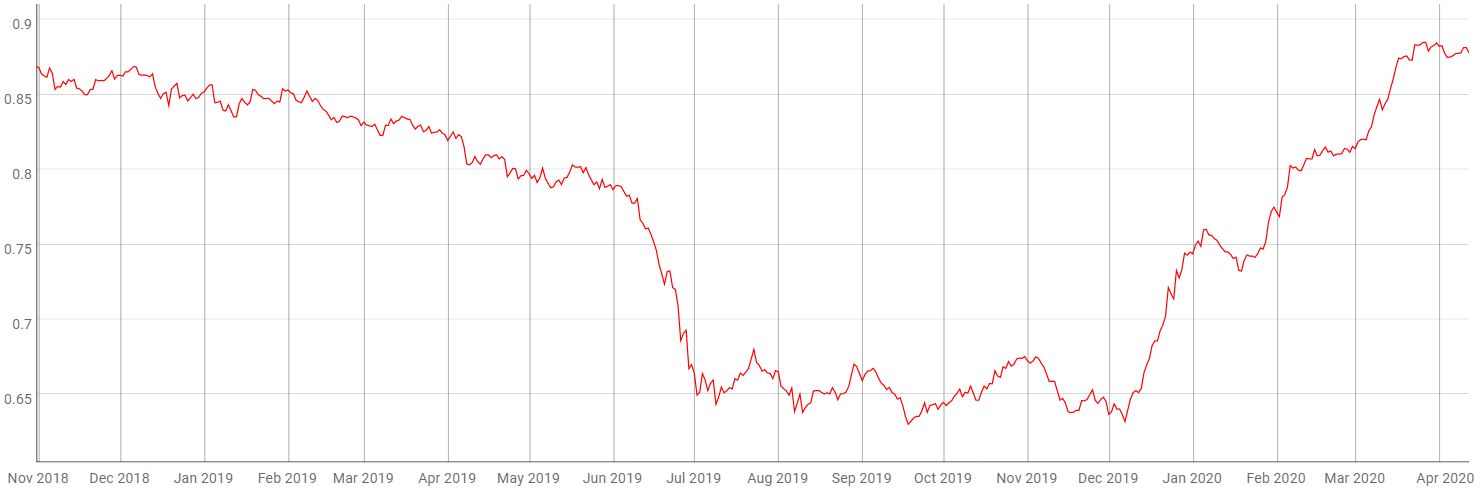
Source: CoinMetrics
The tide has turned negative after Bitcoin suffered a pullback to $6,600-mark which propelled Litecoin’s price to decline. Given the high correlation of Litecoin to Bitcoin, its pumps and dumps have been closely mimicked by the silver crypto. Currently, the correlation coefficient for BTC-LTC stood at 0.877 and this figure has been rising since early December 2019.
Conclusion:
The bearish breakout for Litecoin was predicted in the near-term which could lead its coin to retest previously breached support points at $30.63 and $22.72. In a highly unlikely case of a breakout to the positive side, resistance points for the coin stood at $46.78 and $52.48.