Litecoin, Monero, BAT Price Analysis: 20 November

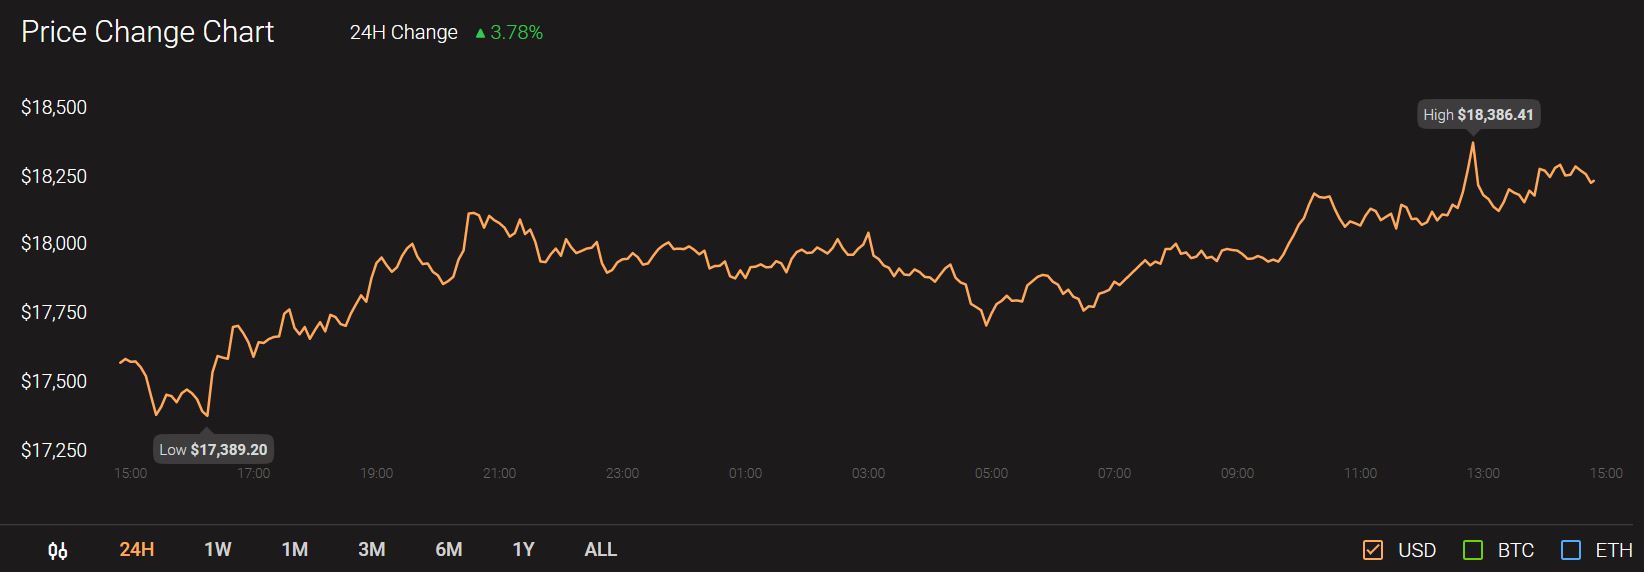
The past week saw Bitcoin scale new heights with the coin going past its $18K resistance in a bid to recreate the historic 2017 rally. At press time Bitcoin was being traded at $18,242 with a trading volume of $23.1 billion.

Source: CoinStats
On the back of the Bitcoin bull run, many altcoins have noted positive gains. However, the upward momentum was not uniformly seen in all altcoins. Coins like LTC surged by over 34 percent however smaller coins like BAT seem to have been stuck in strong sideways price action.
Litecoin [LTC]

Source: LTC/USD, TradingView
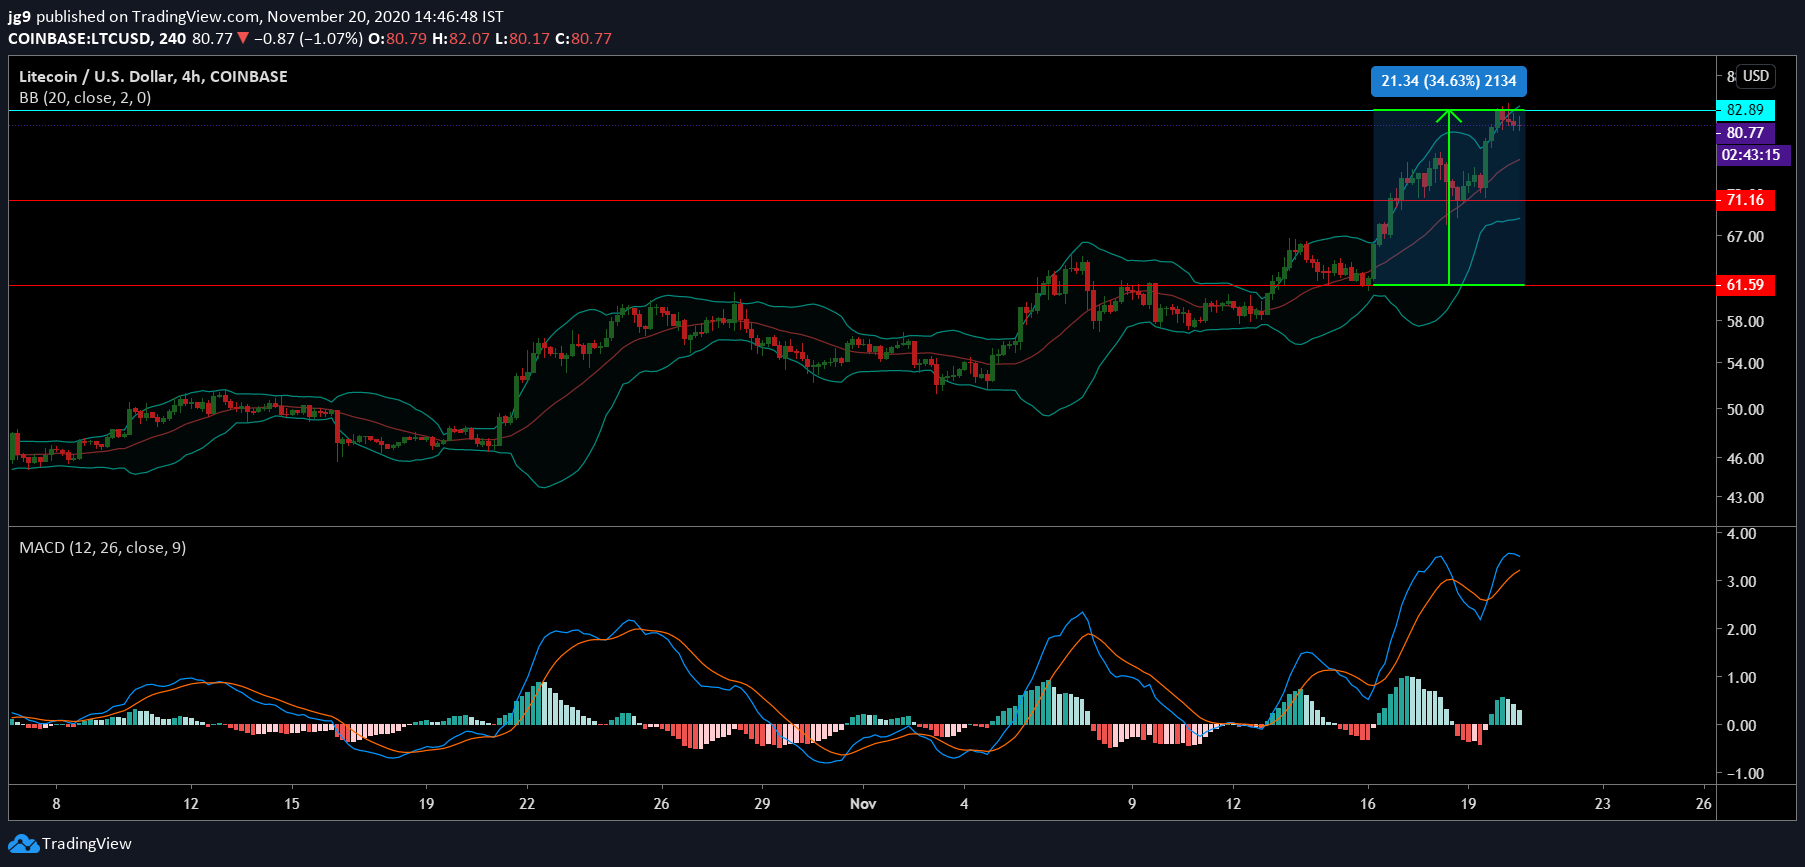
Litecoin is ranked sixth in terms of market cap and in the past week saw its price increase by over 34 percent. At press time LTC is being traded at $81.4 with a market cap of $5.34 billion. Interestingly, the coin’s price has now come in contact with resistance at the $82.8 price level. However, if the coin were to see a fall in the charts, then it can rely on the supports at $71 and $61.5.
The Bollinger Bands continue to remain fairly wide for the coin implying the continued presence of volatility in the coin’s price. The MACD indicator underwent a bullish crossover and show no short-term possibility of a reversal.
Monero [XMR]

Source: XMR/USD, TradingView
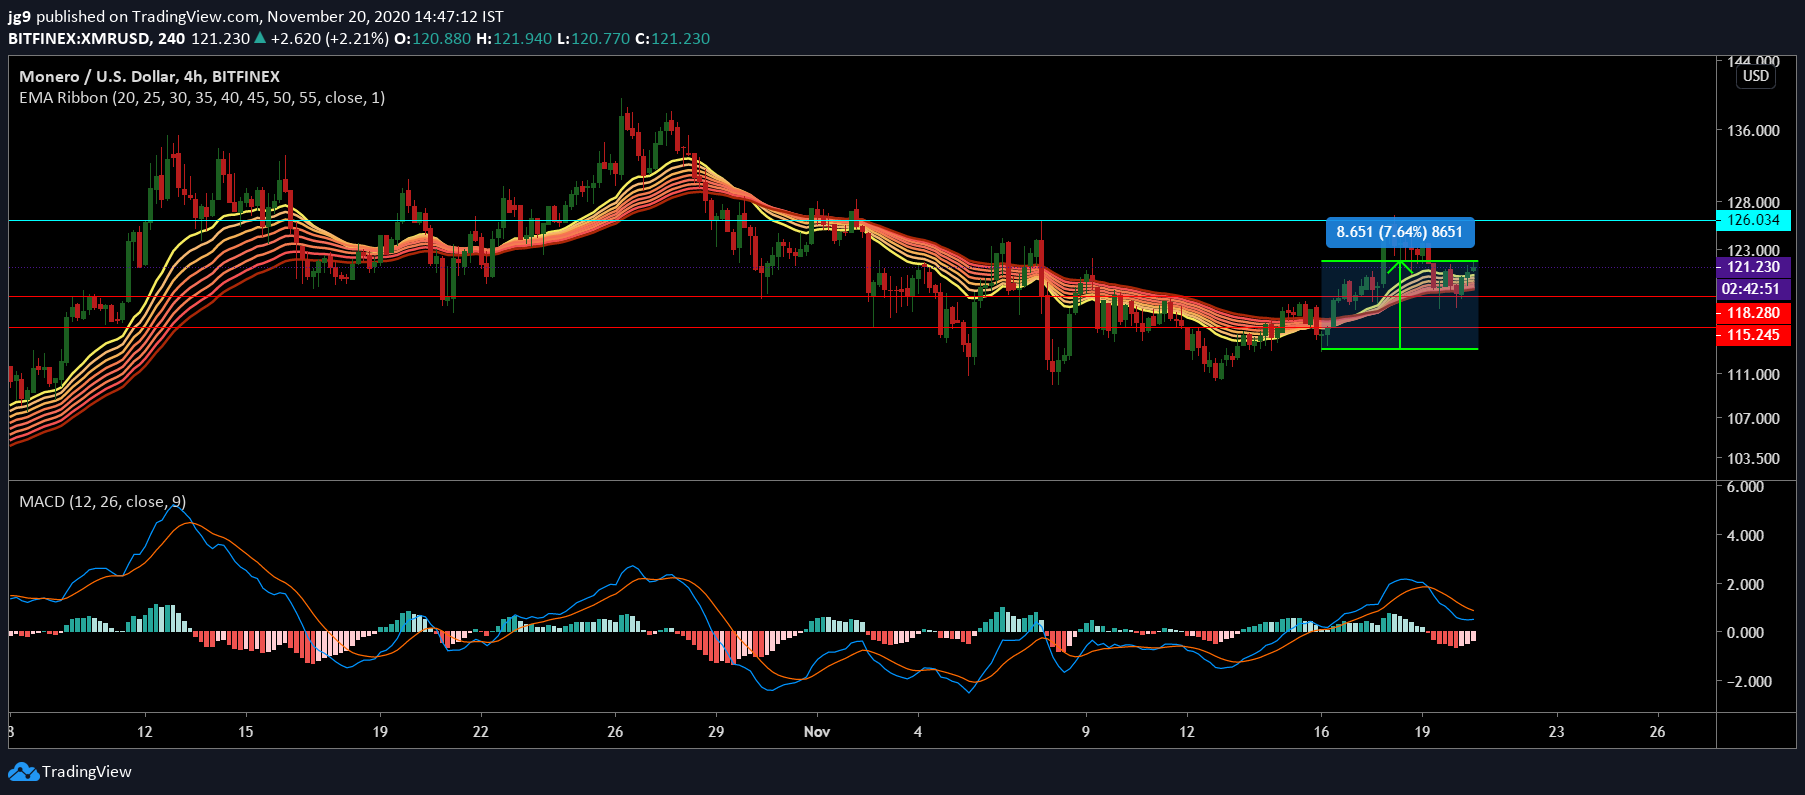
Monero’s price rose by over 7 percent in the past week and is now trading at $121.2. The privacy coin now has a market cap of $2.1 billion and in the past 24-hours saw the price endure a correction of -1.2 percent. At press time the coin is close to testing the support at $118 and if the bullish momentum were to continue it may soon be on its way to try and breach the resistance at $126.
The EMA ribbons after having settled below the coin’s current trading price is likely to offer support if the coin is faced with bearish pressure. The MACD indicator has undergone a bearish crossover and signals the likelihood of the correction to continue.
Basic Attention Token [BAT]

Source: BAT/USD, TradingView
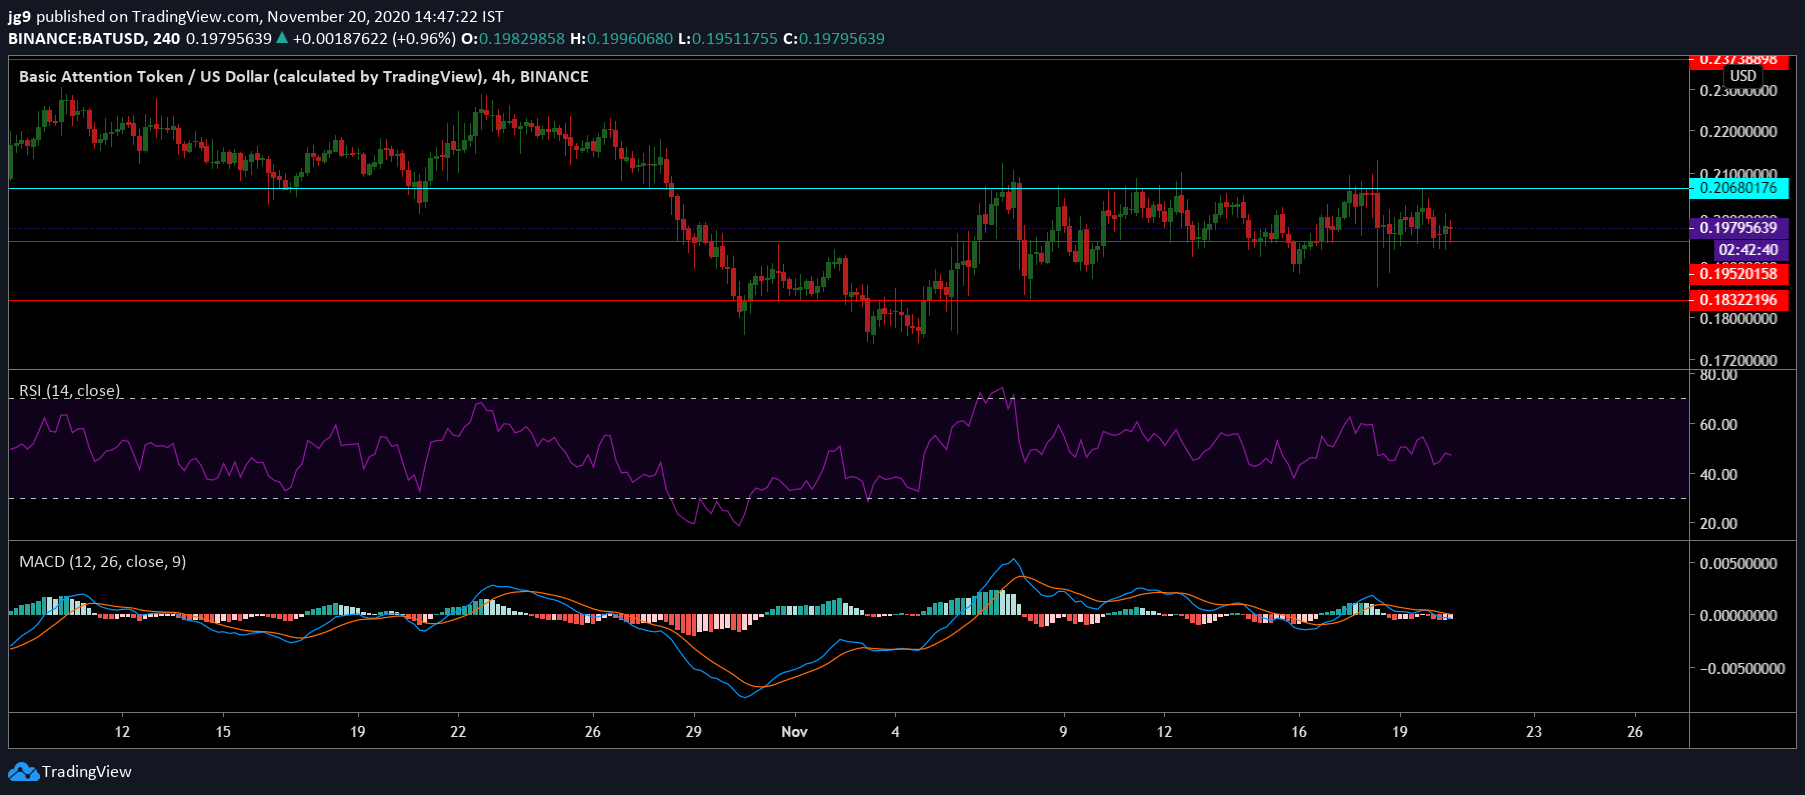
BAT is now trading at $0.197 with a key resistance level at $0.206. The coin is currently testing the support at $0.195 and spent the past week consolidating its price between these two levels.
Both the RSI and the MACD indicator paint a bearish picture as the former is heading into the oversold zone while the latter has undergone a bearish crossover.

![Reasons why Litecoin [LTC] investors should be concerned](https://engamb.b-cdn.net/wp-content/uploads/2023/12/ambcrypto_A_Litecoin-themed_scen-400x240.png.webp)


