A case of better late than never, the altcoin market is finally rallying behind Bitcoin, and Litecoin is following suit. With Bitcoin consolidating above $15,000 for the first time in 2020, LTC was trying to find its feet in the market. While uncertainty might plague its immediate trend, in the long-term Litecoin might re-test its February 2020 highs over the course of the next month.
Litecoin 1-day chart

Source: LTC/USD on Trading View
Litecoin’s 1-day chart suggested a bullish breakout from a descending channel on 22nd October. It was on the same day that LTC surged above $50 and has remained above ever since. The old resistance range (grey rectangle box) is currently acting as a support range for the present trend. While a proper breakout is currently taking place, the price is also incurring underlying support from the 50-Moving Average.
The trading volume attained a recent high on October 22nd and October 5th, both days being monumental as Litecoin breached above $50 and $60 respectively. The high trading volume during the spike suggested buyers were pushing the price in a bullish direction.
Market Reasoning
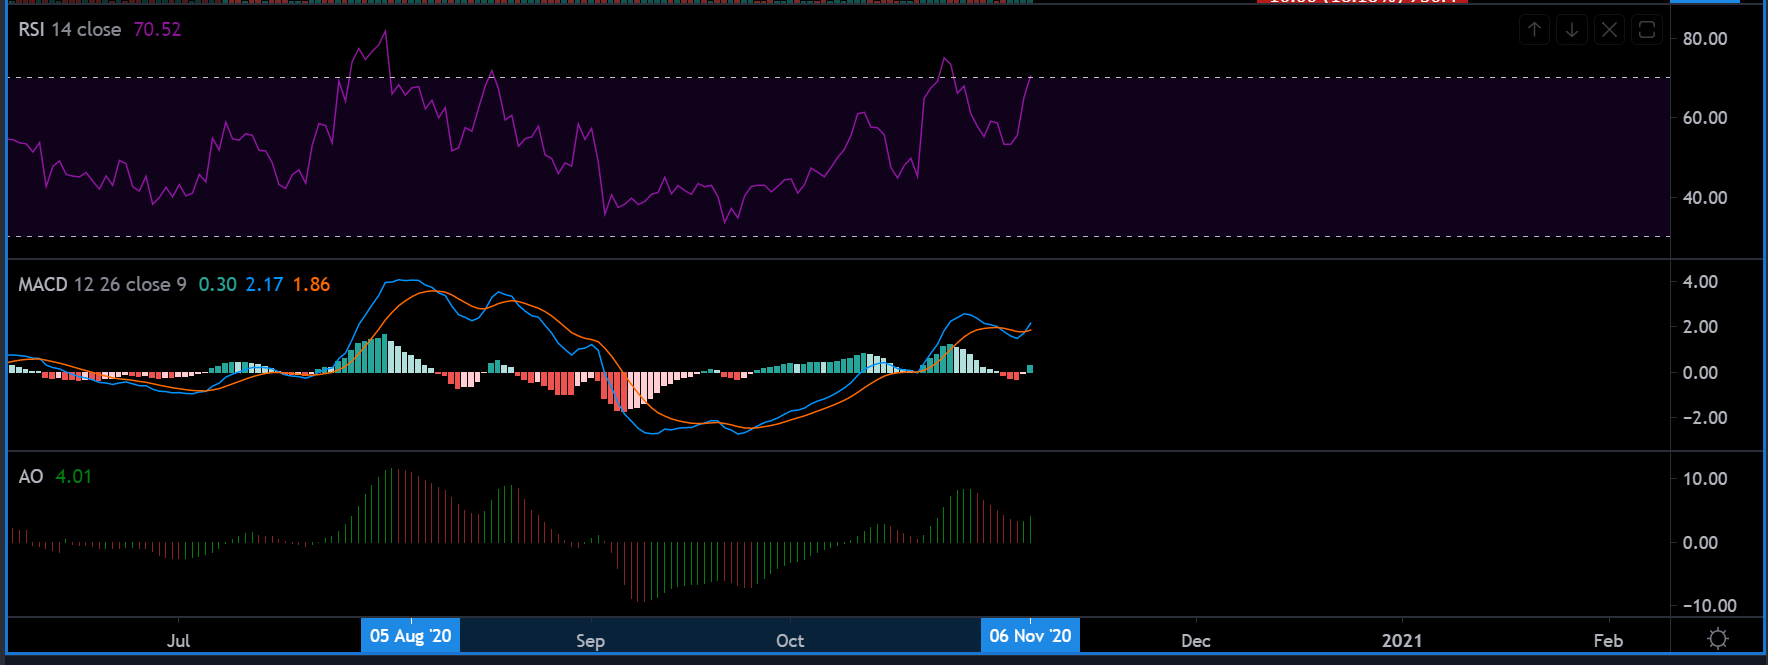
Source: Trading View
Market Indicators were a little contradictory. Relative Strength Index or RSI is currently re-testing a position in the overbought zone, and a period of correction may take place. However, on the other hand, MACD completed a bullish crossover over the past 12-hours, and seemingly predicting a bullish rally going forward.
Awesome Oscillator also pictured the return of green candles, indicating the rising bullish momentum. Hence, RSI may rise over the next few days before eventually attaining a period of correction.
Important Levels
Immediate Resistance: $65
Immediate Support: $55
Support range: $50-$45
Entry Point for Long-Position: $52-$50
Take Profits: Immediate at $65 while Long-Term at $84 with a Risk/Reward of 2.9x.
Stop Loss: $45
Conclusion
Right now, the trend might endure turbulence, swinging sideways between $50-$65. However, the long-term is appearing bullish considering the impact of Bitcoin on the larger market remains consistent. Litecoin will have the momentum to re-test its February 2020 highs but the timeline of the re-test may be subject to change according to the overall market.
![Reasons why Litecoin [LTC] investors should be concerned](https://eng.ambcrypto.com/wp-content/uploads/2023/12/ambcrypto_A_Litecoin-themed_scen-400x240.png)