
Over the past 3 days, Litecoin registered a 15.12 percent growth on the back of another spike, as its valuation crossed the $60 dollar mark. At press time, LTC’s price remained just above $60.
1-hour chart
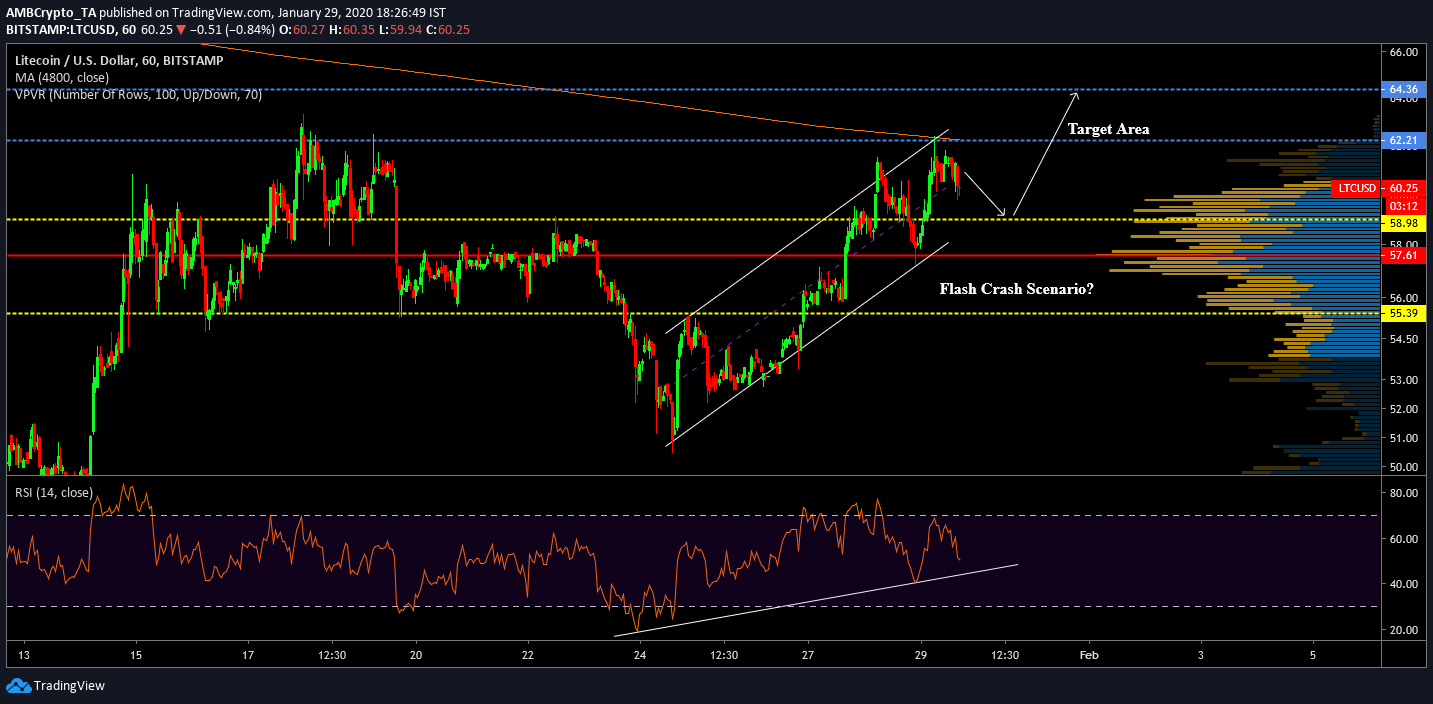
LTC/USD on Trading View
The 1-hour chart of Litecoin exhibited consistent growth registered after over the past 5 days, leading to the formation of an ascending channel. The channel has been tested multiple times on the lower trendline and an imminent correction is on the cards for the asset. Litecoin breached resistance at $58 with the recent spike on 28th January, indicating the continued presence of bulls in the market. The major resistance at $62.21 was briefly touched but minor corrections affected the coin.
According to the VPVR indicator, the majority of trades over the past 3-weeks has taken place around $57, which is the Point-of-Control for Litecoin. The imminent bearish pullback would be a constructive one only if the dip tests the support levels at $58.98. A slump below the support or POC would increase the probability for a crash which may take Litecoin below $55. Although, it is least likely to happen over the next few days.
RSI indicator has also formed a bullish uptrend with the current market movement, indicating the possibility of another bullish surge after corrections. However, the 200-Moving Average continued to remain a strong resistance for LTC, which was tested during the last price pump.
1-day chart
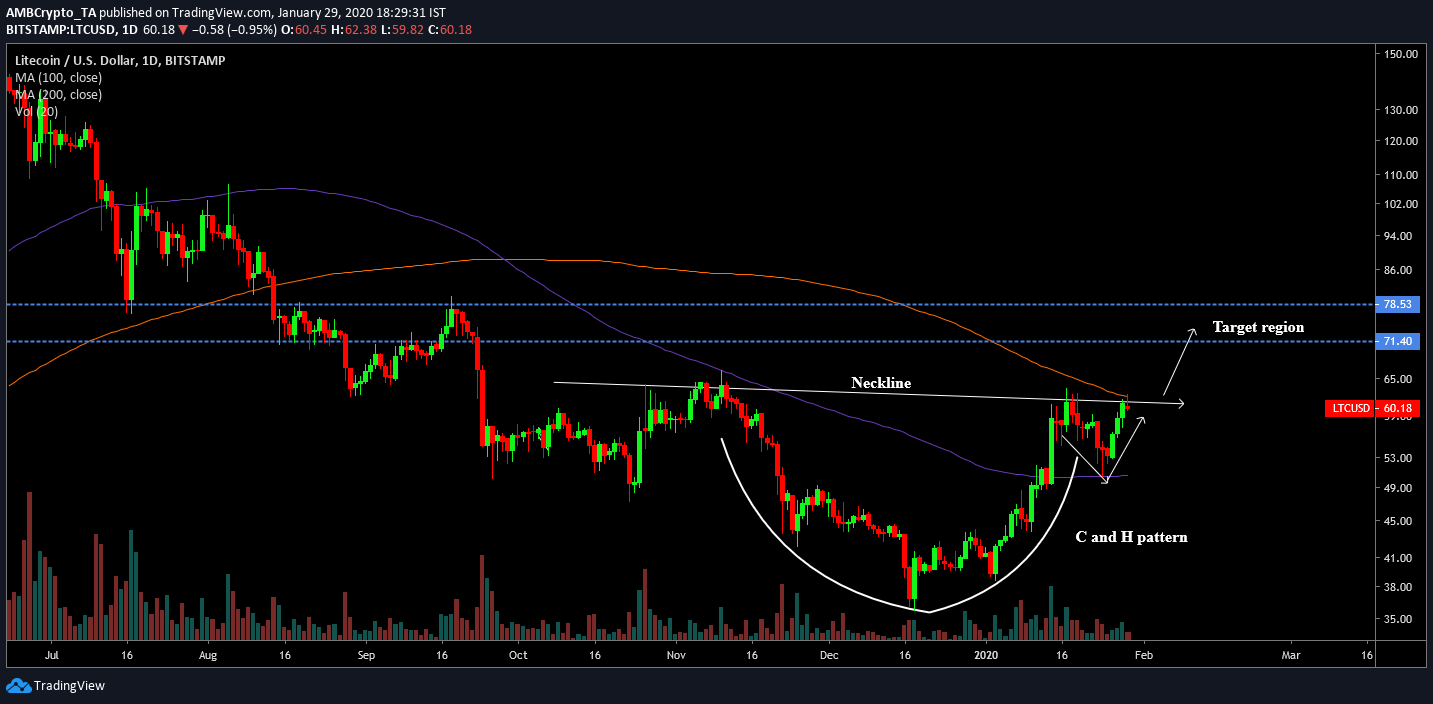
LTC/USD on Trading View
Litecoin’s 1-day chart would re-assure LTC proponents. LTC’s long term chart pictured the formation of a prominent Cup and Handle pattern (i.e C-H pattern), which is a significant bullish pattern that usually occurs over a longer time duration. The pattern started taking shape from the start of November, and the neckline has been tested a few times over the past 3 months.
At press time, the C-H pattern had fully formed and the breakout should pump LTC’s valuation above the $71 resistance line. A positive breakout should allow Litecoin to move in the range between $71-$78 by mid-February.
Conclusion
In the short-term, Litecoin faces few days of correction, but it should bounce back from support levels of $58.98. However, the long-term chart should be a silver lining for LTC investors.