Bitcoin Dominance stood steady at around 63% even as Ethereum and the altcoin market posted gains over the past few days and matched Bitcoin’s performance. Longer-term analysis pointed toward a possible pullback to $400 for Ether, while in the short-term ETH could see the $580 region retested as support. Tezos was trading within an ascending channel, and Basic Attention Token also showed strong bullishness.
Ethereum [ETH]

Source: ETH/USD on TradingView
Ethereum ascended past the psychological $600 level once more, after its recent drop to $480 being a minor speck in the rearview mirror for the bulls already.
From a technical standpoint, ETH was in a steady uptrend with a strong trading volume across the past couple of days to legitimize the rise past $550.
The RSI also indicated an uptrend in progress and showed bullish momentum with a value of 68.5. The Stochastic RSI was in overbought territory and the price may revisit $600 and $580 in the coming days.
The social layer model for Etheruem in 2021 with regard to ETH 2.0 can drive a new wave of adoption and impact price positively.
Tezos [XTZ]

Source: XTZ/USD on TradingView
XTZ was trading within an ascending channel and was headed to test resistance at $2.56. The OBV showed healthy buying volume behind the rise in price, while some trading sessions also saw notable volume to illuminate XTZ changing hands.
The drop from near $3 to $2.1 for XTZ in recent days has been retraced by close to 50%, which also showed that this was not a mere bounce for XTZ.
A close outside the channel could see XTZ drop to $2.24 level of support, and possibly as low as $2 if Bitcoin and Ethereum also saw selling pressure.
Basic Attention Token [BAT]
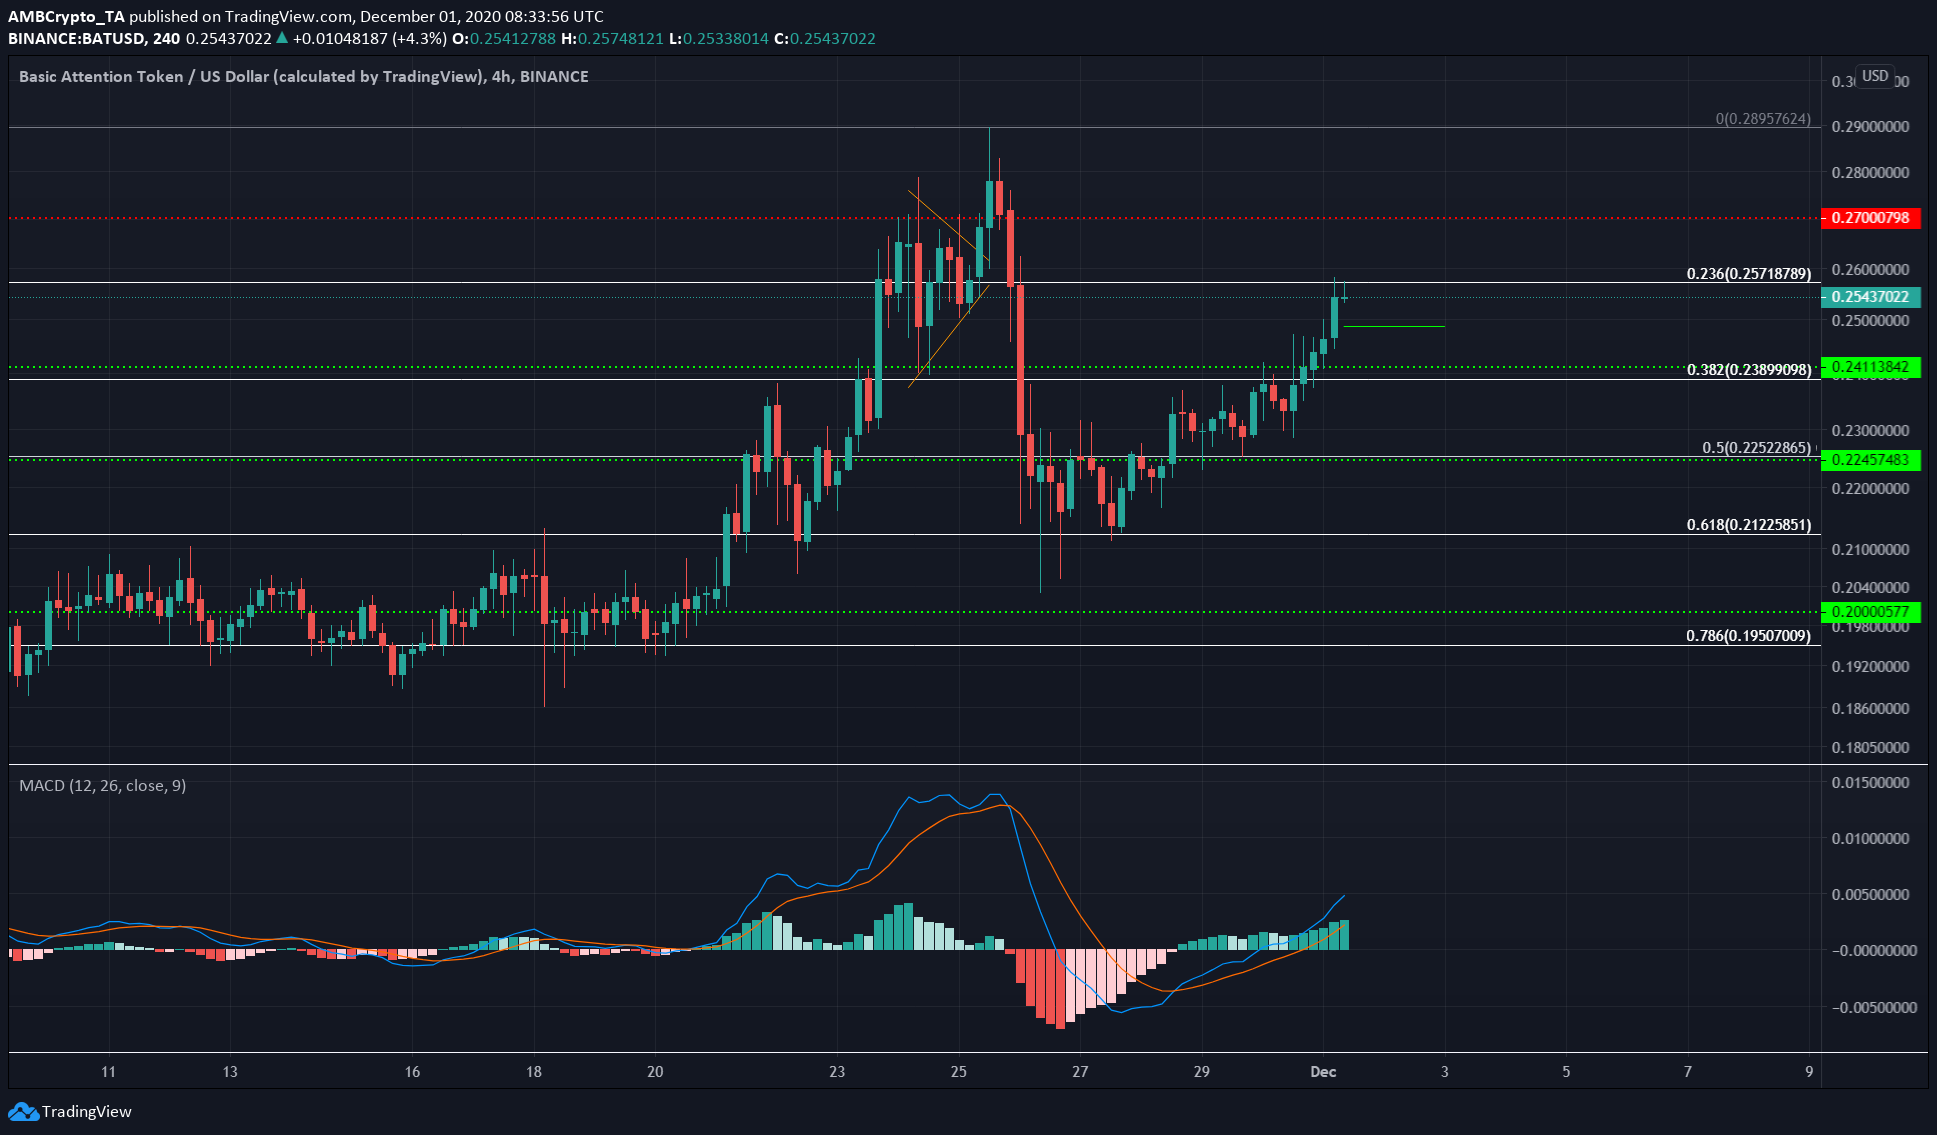
Source: BAT/USD on TradingView
Using BAT’s upward move from $0.175 to $0.289 in November, Fibonacci Retracement levels were drawn to highlight some important levels for BAT.
The price has risen past the 38.2% level and at the time of writing faced some resistance at $0.257. The MACD showed bullish momentum and BAT was likely to flip the 23.6% level to support and continue its upward march.
BAT could face some selling in the form of take-profit at the current level and dip to $0.248, the nearest liquidity pocket. Yet its outlook remained bullish for the coming week.