
Ethereum is trading above $600, just as it did over the past weekend. What’s interesting however is that despite its dropping correlation with Bitcoin, the price has sustained at the current level. The latest developments in Ethereum charts indicate that the narrative that led to the BTC price rally may be brewing for Ethereum as well. Over the past two months, the increase in Ethereum transactions is nearly the same as the first week of November and alongside that, miner revenue and network transaction fees have increased.
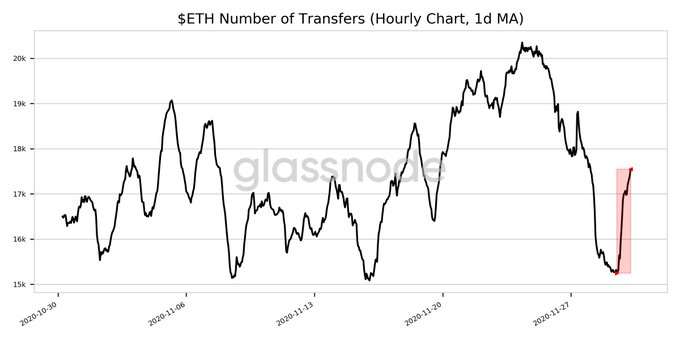
Ethereum transactions Hourly chart || Source: Glassnode
The pattern emerging in this chart interestingly supports a further increase in the number of Ethereum transactions in the following week. Since an increase in transactions in the Ethereum network is accompanied by a drop in the active supply of the altcoin, the price rally may be sustained. Right before the launch of ETH 2.0, there is a drop in Ethereum’s active supply. The 1y-2y (1d Moving Average) has reached an 11-month low of 23,028,693.493 ETH. The previous 11-month low of 23,134,927.958 ETH was observed on 03 January 2020, nearly 11 months back.
The pattern emerging in this chart interestingly supports a further increase in the number of Ethereum transactions in the following week. Since an increase in transactions in the Ethereum network is accompanied by a drop in the active supply of the altcoin, the price rally may be sustained. Right before the launch of ETH 2.0, there is a drop in Ethereum’s active supply. The 1y-2y (1d Moving Average) has reached an 11-month low of 23,028,693.493 ETH. The previous 11-month low of 23,134,927.958 ETH was observed on 03 January 2020, nearly 11 months back.
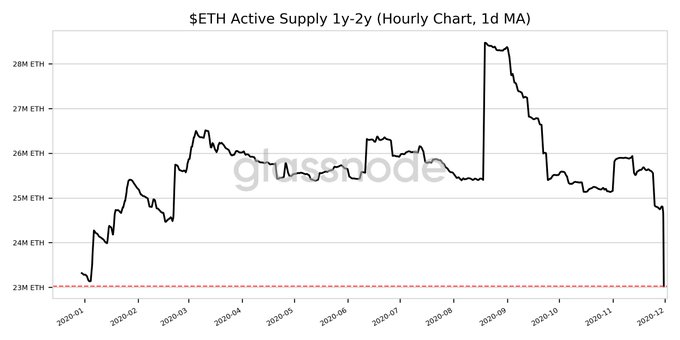
Ethereum Active Supply || Source: Glassnode
Back in January 2018, metrics like active supply and hourly transfers were at a similar level. The highest daily increase in Ethereum’s unique addresses was recorded in Jan 2018 as 355,726 and currently, the daily increase is 352,638. Ethereum is getting closer to the demand of 2018, based on data from Etherscan.
The 2018 price rally was a result of high demand generation on spot and derivatives exchanges and Ethereum’s correlation with Bitcoin, and on comparing the current scenario with 2018, we see that the demand generation is close enough to the 2018 level, for the first time in the last two years. Ethereum continues to enjoy a correlation with Bitcoin, though lower than expected by on-chain analysts, and metrics like transaction count, miner revenue, and active supply all signal towards a longer and sustained price rally. The case for Ethereum’s price correction exists, just as it does for Bitcoin, however, the probability of a sustained price rally is higher due to the “supply shortage” and increase in demand on exchanges right before the launch of ETH 2.0.