
EOS was trading above a level of support on the charts, but buying volumes for the crypto-asset were falling. Further down the crypto-ladder, IOTA seemed to be forming a bullish pattern, but it wasn’t complete yet. A drop in IOTA’s value would invalidate the same. Compound was on a short-term uptrend and its direction in the coming days would be decided on the defense of its imminent support.
EOS
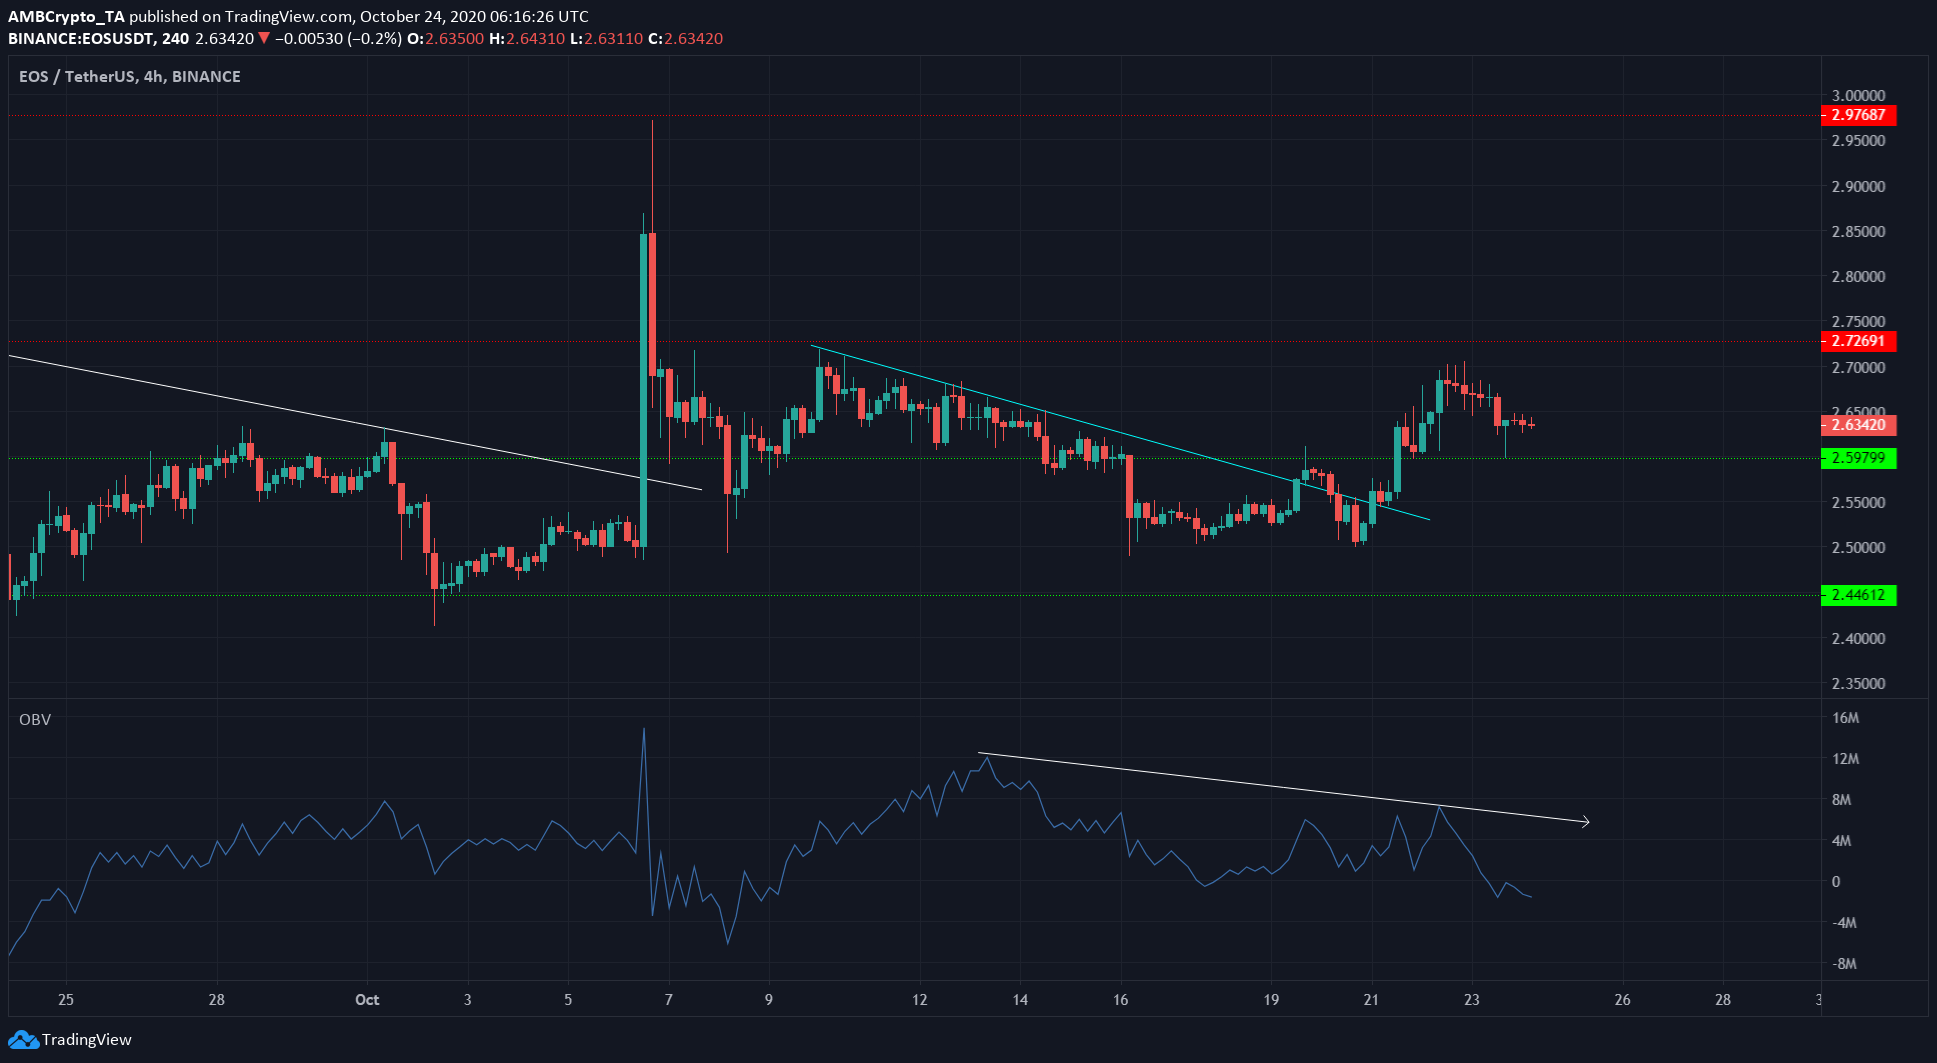
Source: EOS/USDT on TradingView
EOS was trending downwards before a surge pushed it to $2.85 from $2.45 in the first week of October. After testing $2.59 as support, the price began to head south once more (cyan).
EOS broke out upwards, past its trendline resistance once more as it appeared to flip $2.6 from resistance to support.
However, the OBV showed a fall in buying volume (white). This lack of buyers’ interest, while the price appeared to form higher lows and trended upwards, was a disagreement.
Buyers would have to flood into the market and the OBV should breach the descending trendline or the price would see a correction in the next few days.
IOTA
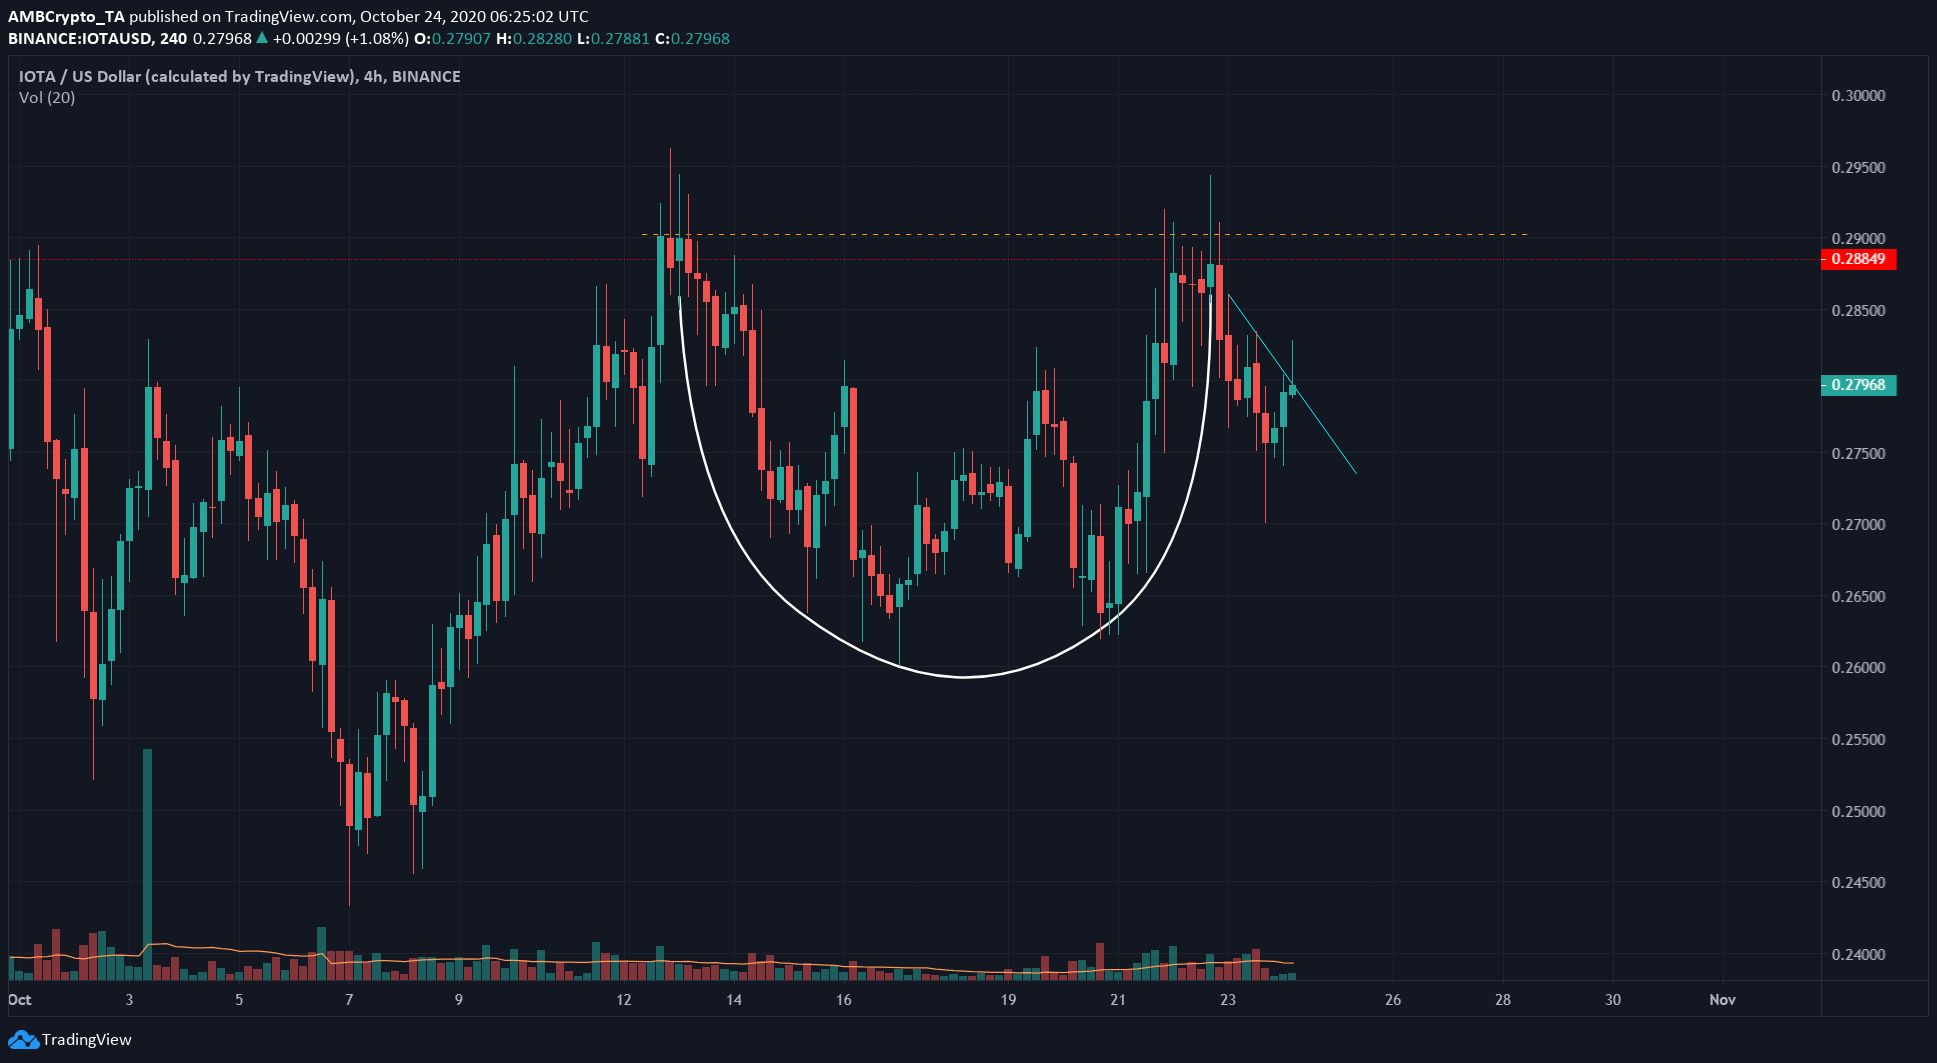
source: IOTA/USD on TradingView
IOTA formed a cup and handle pattern (white and cyan) on the charts and could give aggressive traders a long entry confirmation, if it closes above the handle.
However, the past few trading sessions had remarkably low trading volumes, even as IOTA made some gains in an attempt to move north past the handle.
This suggested that caution was advisable when entering a long position. A safer bet would be a close above the rim of the cup (orange, dotted) which projected a rise to $0.32. Traders should also look out for significant trading volume during a breakout session.
Compound [COMP]
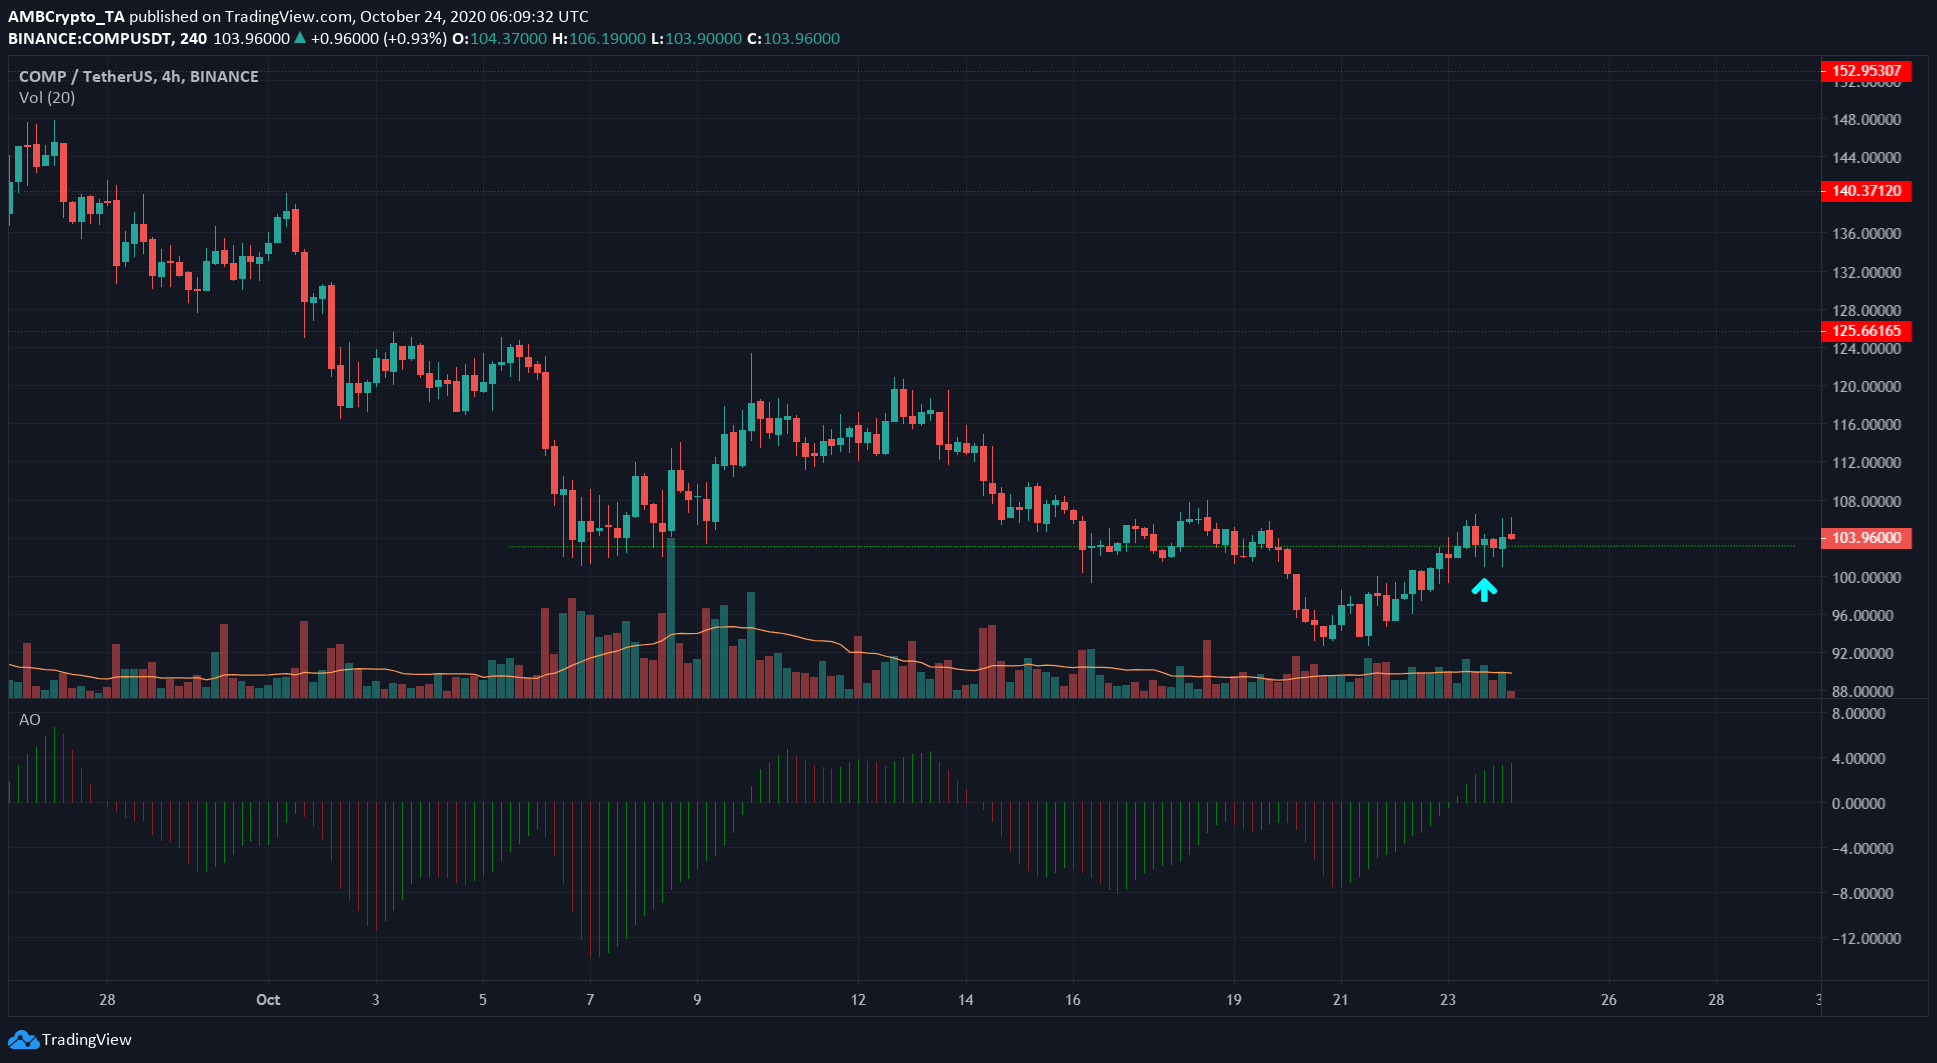
Source: COMP/USDT on TradingView
The cyan arrow highlighted the bearish pressure on the price over the past few trading sessions, yet bulls did not allow the price to close below $103. There was also a good degree of trading volume over the past few sessions.
There was a possibility that COMP had bottomed at $94 and was set to rise higher, now that it had flipped the important psychological level of $100.
However, COMP has been in a steady longer-term downtrend and the recent move might be another bounce.
Hence, even though the AO indicated strengthening bullish momentum in the short-term, it could be a better option to wait for a trend reversal signal before entering a short position.