Crypto.com Coin, Monero, Synthetix Price Analysis: 21 October

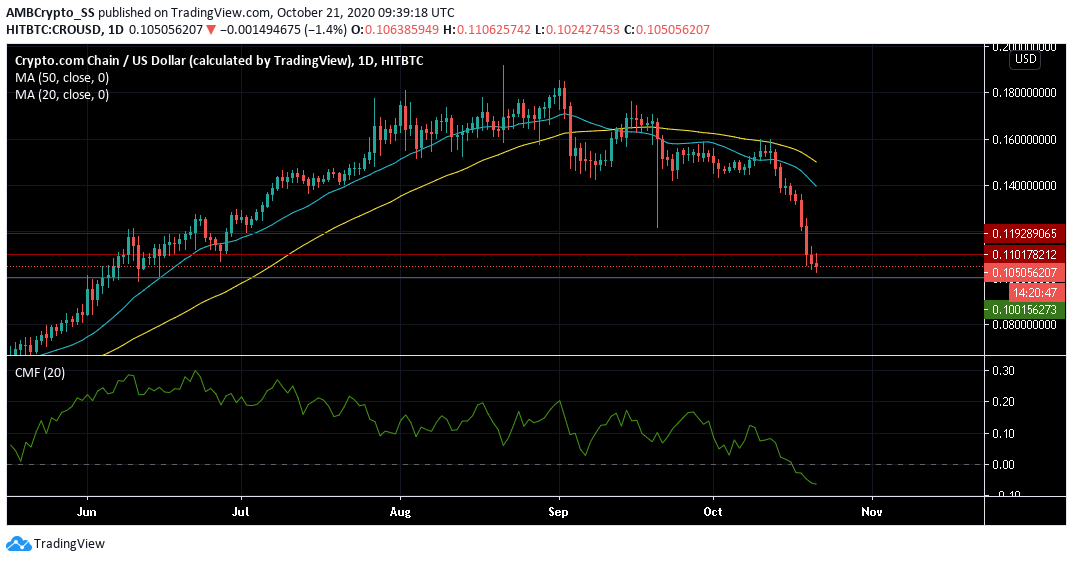
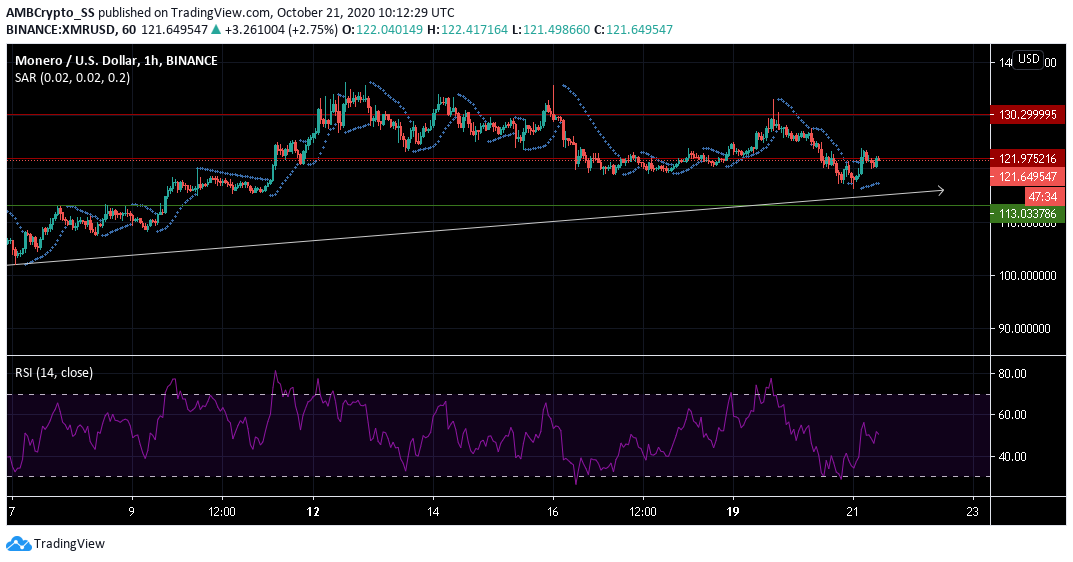
After witnessing a brief sell-off period just two days back, the privacy coin Monero regained its bullishness. The presence of bearish sentiment was confirmed by the moving averages for Crypto.com Coin, with the digital asset falling back to its June 2019 lows.
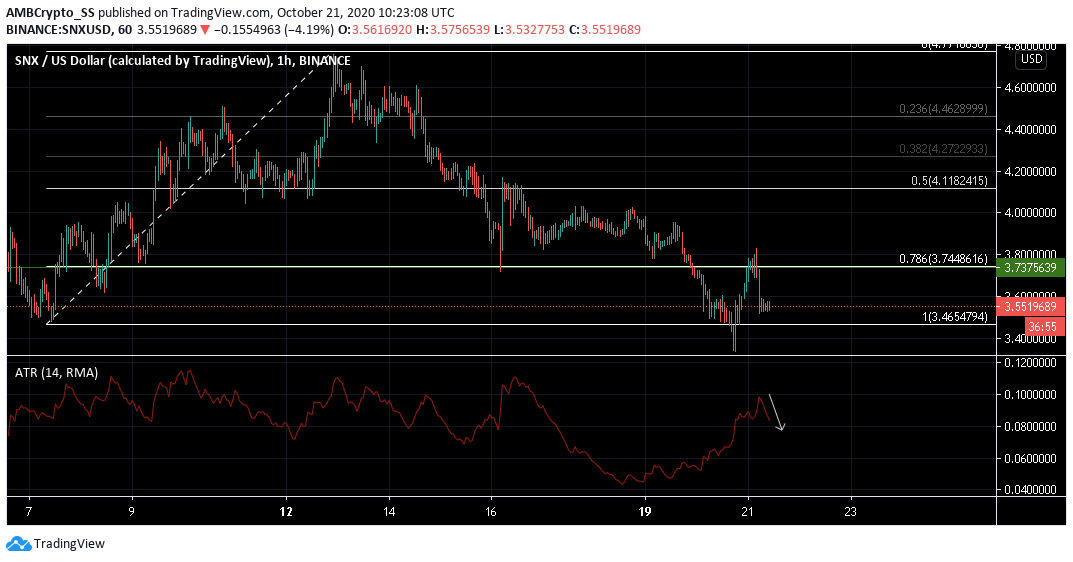
Given Synthetix’s persistent downtrend and a clear bearish outlook, the SNX market was likely to witness a few more rounds of selling pressure.
Crypto.com Coin [CRO]

Source: CRO/USD on TradingView
At press time, Crypto.com Coin was trading at $0.105, at the same level of its June 2019 lows. The digital asset maintaining its highly bearish outlook was further down by almost 5% since yesterday.
Further, the Chaikin Money Flow dived below the zero-line meaning a large amount of capital was flowing out of the CRO market, hinting towards a strong selling pressure.
The two simple moving averages with the 50 period SMA above the 20 SMA signified a bearish scenario. The bears were marching on in the CRO market as they lowered the prices towards the $0.1101 level of support far below the two SMA’s.
Given the bearish scenario, the price of CRO is likely to fall further below the immediate support, over the next few days, as the bulls fail to stall the selling pressure.
Monero [XMR]

Source: XMR/USD on TradingView
Monero, trading at $121.649 at press time was witnessing an overall uptrend. The Relative Strength Index (RSI) signaled the presence of a rising buying sentiment in the XMR market.
A bullish rally also seems likely as the dotted lines of the Parabolic SAR below the candles hinted at the possibility of an upward price trend. This could push the price above the immediate resistance at $121.975.
This means if the price does not witness a short-term consolidation along the current resistance, Monero could be headed for further gains in the near future.
Synthetix [SNX]

Source: SNX/USD on TradingView
For the month of October, SNX had traded mostly between the 50% and 100% retracement levels highlighted by the Fibonacci Retracement tool. At press time, it was trading at a key pivot level of $3.55, just above the 100% retracement region.
Average True Range (ATR), the technical indicator measuring market volatility had started its downtrend indicating a reduced level of volatility, that might rule out wide price actions in either direction.
Over the next few days, a continued dive towards the 100% retracement level is more likely than a price surge, given SNX’s overall downward trend and lack of any immediate price stability visible.


