Bitcoin reached a two-month high as it touched $12,268 at press time and registered a trading volume of $238.6 billion.
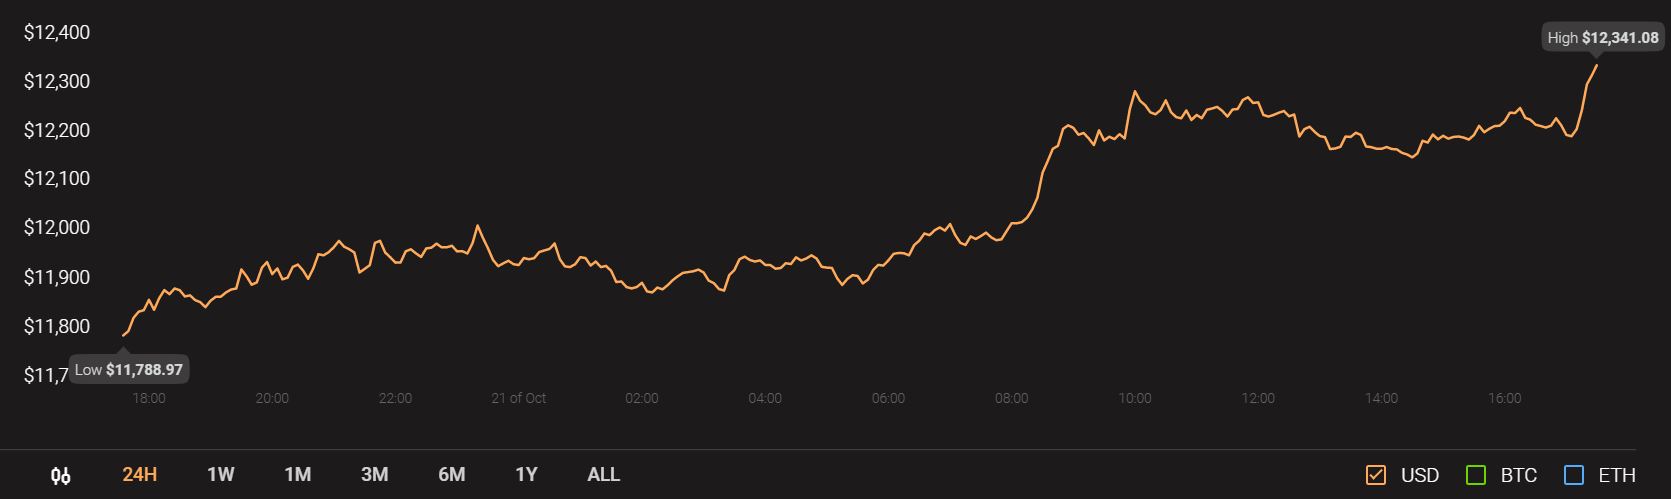
Source: CoinStats
Chainlink showed bearish momentum and could be set to lose $10.5 in the coming days, although a longer timeframe outlook showed hints of bullishness. Tezos failed to breakout to the upside and could lose a strong level of support to reach a new local low while VeChain formed a continuation pattern that could see more losses in the coming weeks for the asset.
Chainlink [LINK]

Source: LINK/USD on TradingView
Using Fibonacci Retracement for LINK’s surge from $6.52 to $20 in early August, some important levels showed up on the charts.
LINK recently found resistance at the 61.8% retracement level, which lies at $11.7. The regions at $10.8 and $10.4 have acted strongly for the asset in the past as well.
A dip below $10.4 to $9.89 occurred a few hours prior to press time, and RSI dipped into the oversold region as well before recovering to neutral.
This showed that there was a possibility for LINK to be rejected by the region at $10.45 in the next few trading sessions.
Tezos [XTZ]

Source: XTZ/USD on TradingView
Tezos formed a rectangle bottom pattern (orange) and appeared to breakout but sellers prevailed in pushing the price back downward.
This represented a busted rectangle pattern, and it can be expected that XTZ can drop as much as 10% beneath the bottom of the rectangle pattern.
This would project a downward target of $1.8 for XTZ in the coming days, which neatly coincided with a level of support at $1.81. XTZ last traded at this price back in May.
The 20 SMA (white) crossing beneath the 50 SMA (yellow) highlighted the prevalent bearishness for XTZ recently.
VeChain [VET]
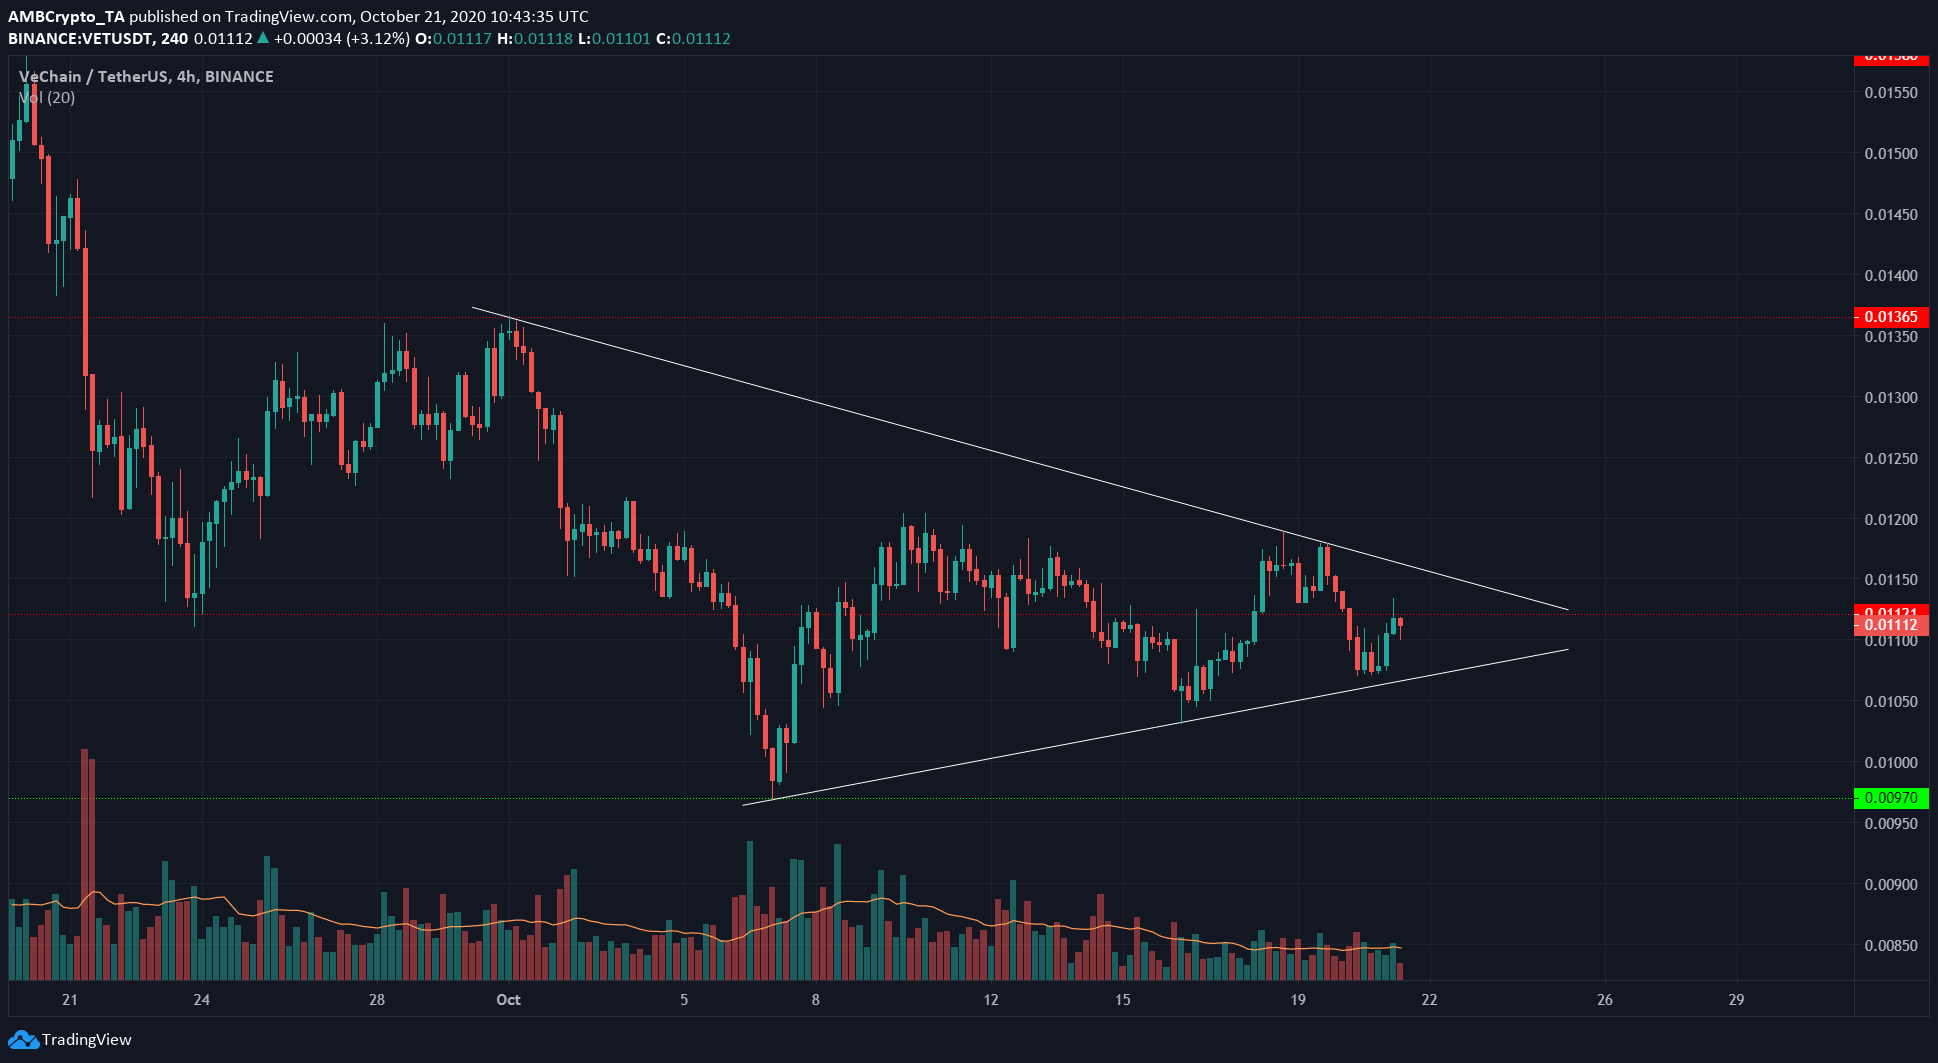
Source: VET/USDT on TradingView
VeChain formed a symmetrical triangle (white), a continuation pattern that sees the price follow the previous trend. When VET was within the pattern, it can be noted that the trading volume has also trended lower.
In the coming days, a breakout to either direction was possible for VET. Given the bullish sentiment around Bitcoin, altcoins can also stand to see some gains.
A close above or below the pattern on a session with above-average trading volume would indicate the next direction for the market, with a downside target of $0.08 and an upside region of resistance at $0.1365.