Chainlink outperforms its peers once again – here’s how

- While the market traded sideways, LINK’s price increased by 6%.
- The value of the token may surpass $16 if the accumulation intensifies.
As it has done on many occasions, Chainlink [LINK] is moving at a faster pace than other top altcoins. At press time, LINK’s price was $15.72.
This was after it gained 6.61% in value in the last 24 hours. Its increase was the highest out of all the assets ranked in the top 20 per market cap.
But that was not the only notable finding connected to the cryptocurrency.
According to on-chain data provider Santiment, the 200 largest Chainlink whales have accumulated $50 million worth of the token in the last five weeks.
?? #Chainlink is moving ahead of the #altcoin field once again, aided by the top whales continuing to accumulate. The 200 largest wallets have added just over $50M $LINK in ~5 weeks. In 5 months, its market cap is +143% overall, and +93% vs. #Bitcoin. https://t.co/HUjTnCY5c9 pic.twitter.com/oAPl9SQaJ5
— Santiment (@santimentfeed) December 2, 2023
Is LINK the reigning king?
The result of the spike in accumulation was shown in the market cap. AMBCrypto’s evaluation of Chainlink showed that the market cap was $8.74 billion at press time.
The increase in market cap is proof that a lot of LINKs have been engaged in transactions while being accompanied by a price increase.
To be fair, LINK’s performance all year long has been spectacular. Apart from outperforming many altcoins, the token has also outpaced Bitcoin’s [BTC] Year-To-Date (YTD) trend.
While BTC’s YTD performance was a 133.51% increase, LINK was higher with $179.55%.
LINK was able to achieve this milestone because of the several times it decoupled from the market trend, and rose on its own. Over the last seven days, AMBCrypto analysts have been observing what’s going on with Chainlink on-chain.
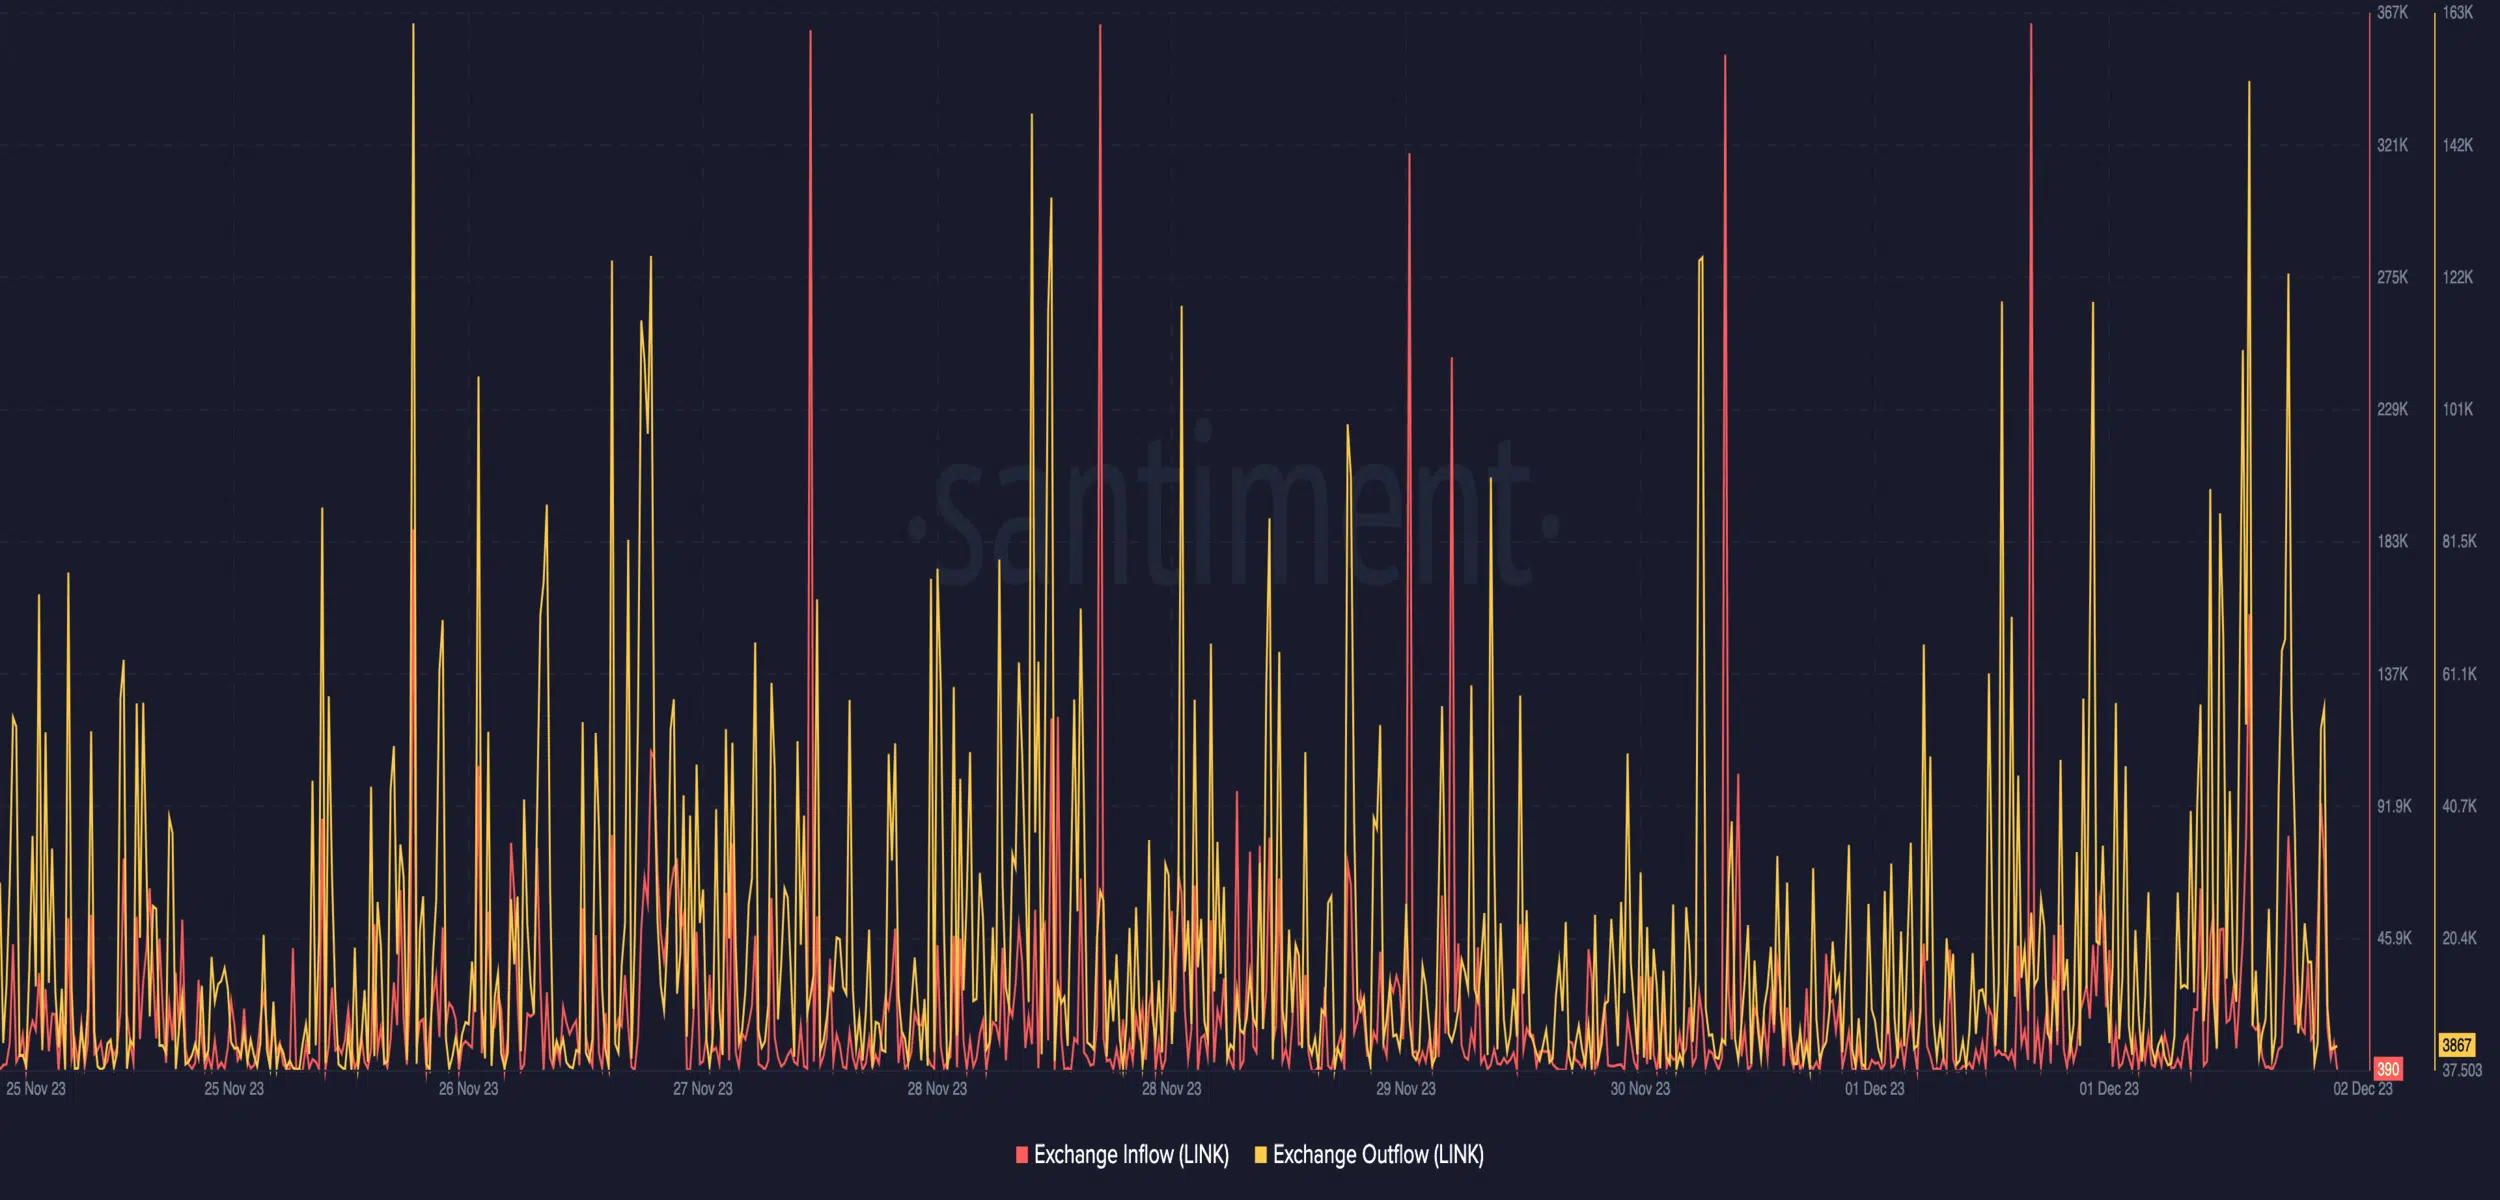
One area we focused on was the exchange activity. As of this writing, LINK’s exchange inflow was 308.
The exchange outflow, on the other hand, was 3867. The interesting part is that the outflow has been much more than the inflow for the past week.
This means that the intent to sell LINK was lower than the buying momentum. In an instance like this, the value of the token may continue to increase.
The next stop might be higher
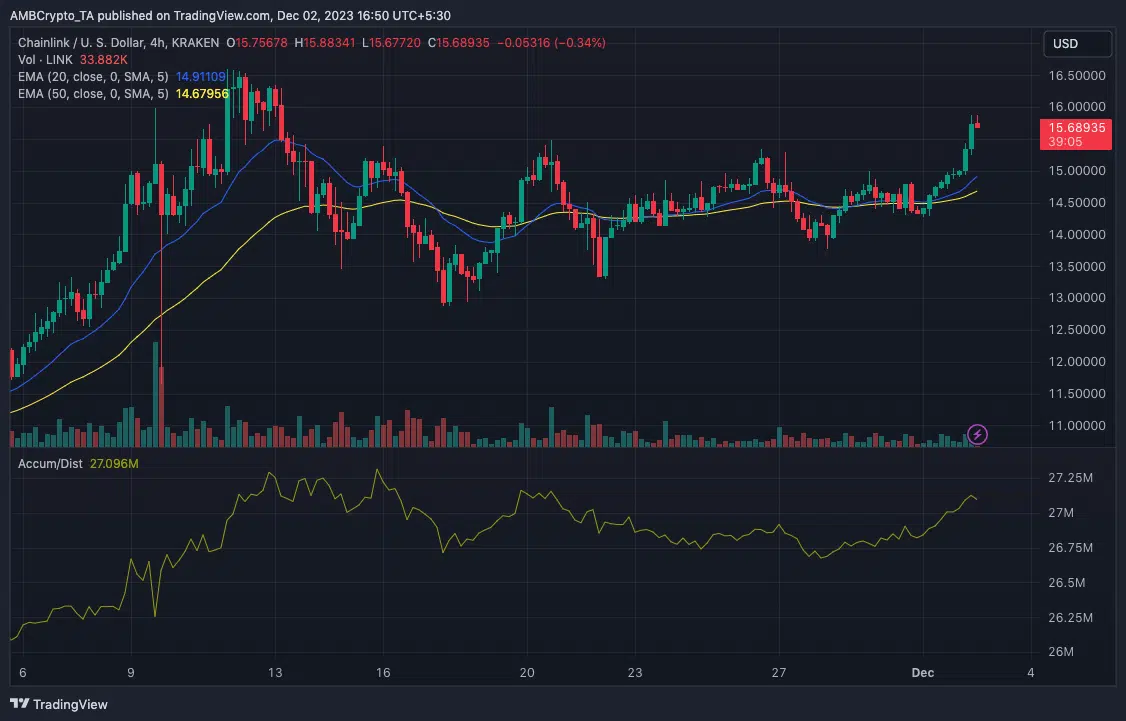
From a technical perspective, the LINK/USD 4-hour chart showed that the bias around the cryptocurrency was bullish. This inference was taken from the Exponential Moving Average (EMA).
At the time of writing, the 20 EMA (blue) had crossed over the 50 EMA (yellow). This crossover is known to precede a bullish trend. If it was the other way around, then the thesis would have been bearish.
So, it is possible for LINK to head in the $16 direction in the short term. If buying pressure is solid, the price may flip the projected value into the $18 region.
One of the bases for this prediction is the Accumulation/Distribution (A/D).
Is your portfolio green? Check the LINK Profit Calculator
Based on the chart shown above, the A/D has increased to 27.10 million, indicating that there has been more accumulation than distribution.
Should bears fail to change their stance, LINK would have no other option than to trend higher.


