Chainlink, at the time of writing, occupied the 12th spot on CoinMarketCap’s charts with a market capitalization of $2.5 billion. While the cryptocurrency did lose a significant chunk of its value during the 12 March price crash, it has risen consistently since. Right from the start of April, Chainlink’s trading price has been on a consistent uptrend and despite the price correction over the last few weeks, Chainlink’s price may see greater heights in the near future.
At press time, Chainlink was being traded at $7.2, with its value rising by 1.34 percent over the last 24-hours, having noted a trading volume of $554 million.
Chainlink 1-day chart
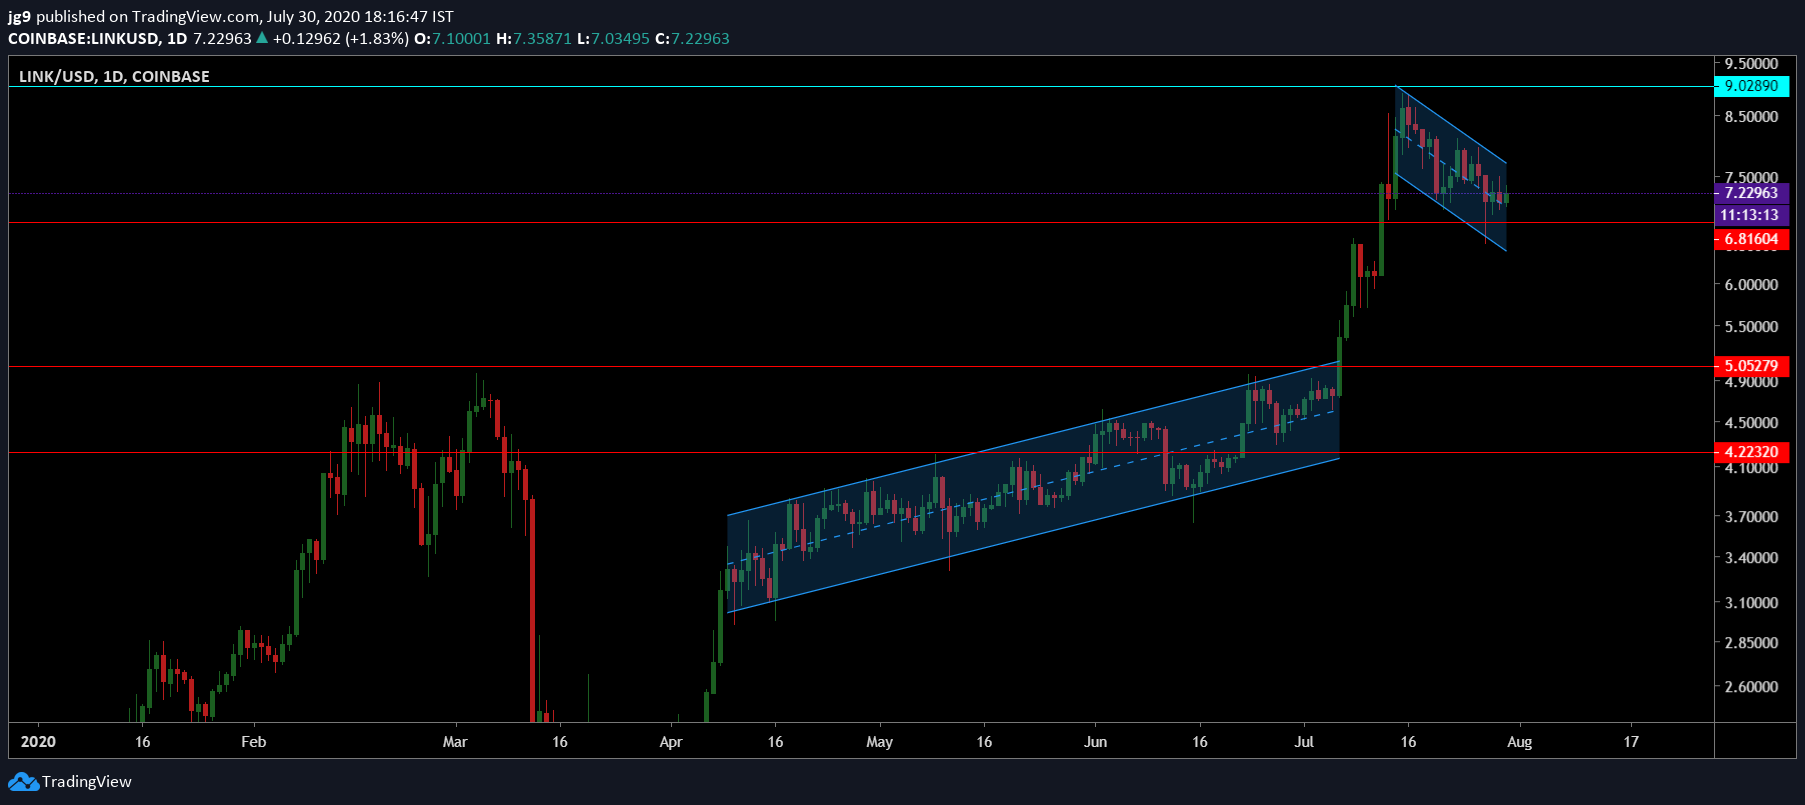
Source: LINK/USD, TradingView
According to Chainlink’s 1-day chart, its price had been in an ascending channel formation since April, with the price candles breaking out of the formation during the start of the month. Since then, the price has surged, while registering a new ATH for the coin.
After a long uptrend and after having been in an ascending channel formation, Chainlink did note a price correction, however, one that has now forced it to be confined within a descending channel formation that was initiated around 15 July.
In the coming weeks, there is the possibility that the price may once again break out of the formation, in which case, it is likely to head towards the resistance at $9 in the hope of the crypto breaching it this time around. On the contrary, if the slight bearish pressure Chainlink is currently faced with endures, it may soon breach the support that was testing LINK at $6.8 and head towards the support at $5.05.

Source: LINK/USD, TradingView
Further, the MACD indicator had undergone a bearish crossover, with the RSI also moving away from the overbought zone and now closer to the neutral zone.
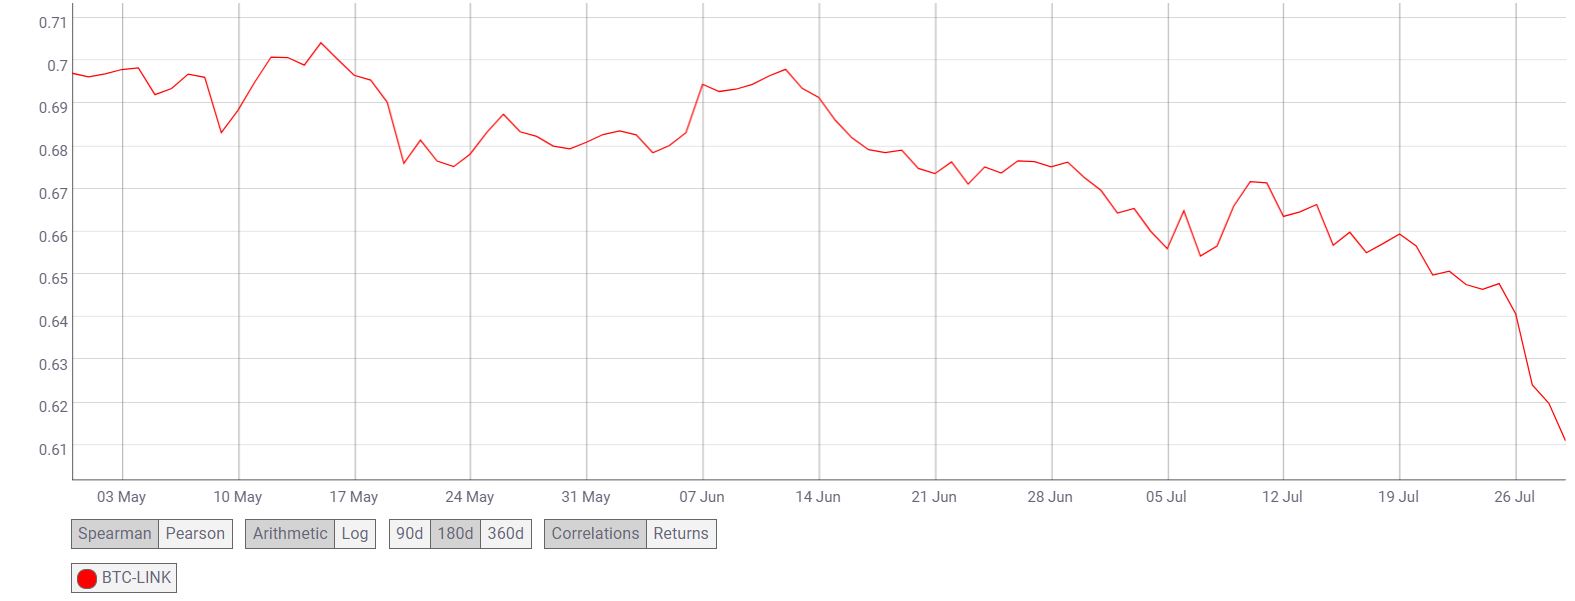
Source: CoinMetrics
Interestingly, Chainlink’s correlation with Bitcoin has taken a substantial hit over the past 3 months. According to data provided by CoinMetrics, BTC-LINK correlation fell from 0.69 to 0.61 and highlighted the coin’s willingness and ability to move independently.
Conclusion
In the next few weeks, Chainlink’s price is likely to either stay within the descending channel formation and head towards $5 price level or bounce off the immediate support and break out of the formation. In the latter scenario, Chainlink may once again head towards the ATH in the first week of August and attempt to breach the resistance at $9.