
Disclaimer: The findings of the following analysis attempt to foresee how the price will unfold over the course of a few days to weeks.
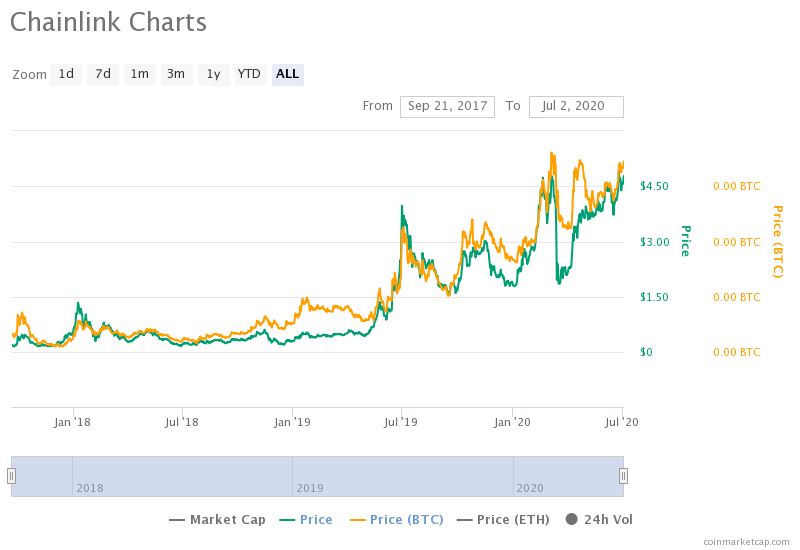
Chainlink’s journey has been nothing short of amazing. From a price point of $0.19 per token, the coin has managed to hit $4 in less than 3 years. In fact, at the time of writing, LINK was noting YTD returns of over 162%, at the time of writing.
What’s more interesting here is that Chainlink has been the figurative underdog as its price appreciation has taken place amidst an extended bear rally.
The Chainlink community is optimistic about the token and its capabilities; especially since Chainlink’s Oracles are now being used by projects like Synthetix, Aave, Ampleforth, etc. It should also be understood that the price of Chainlink’s token is a clear reflection of the project’s development and community sentiment.
Chainlink 4-hour chart
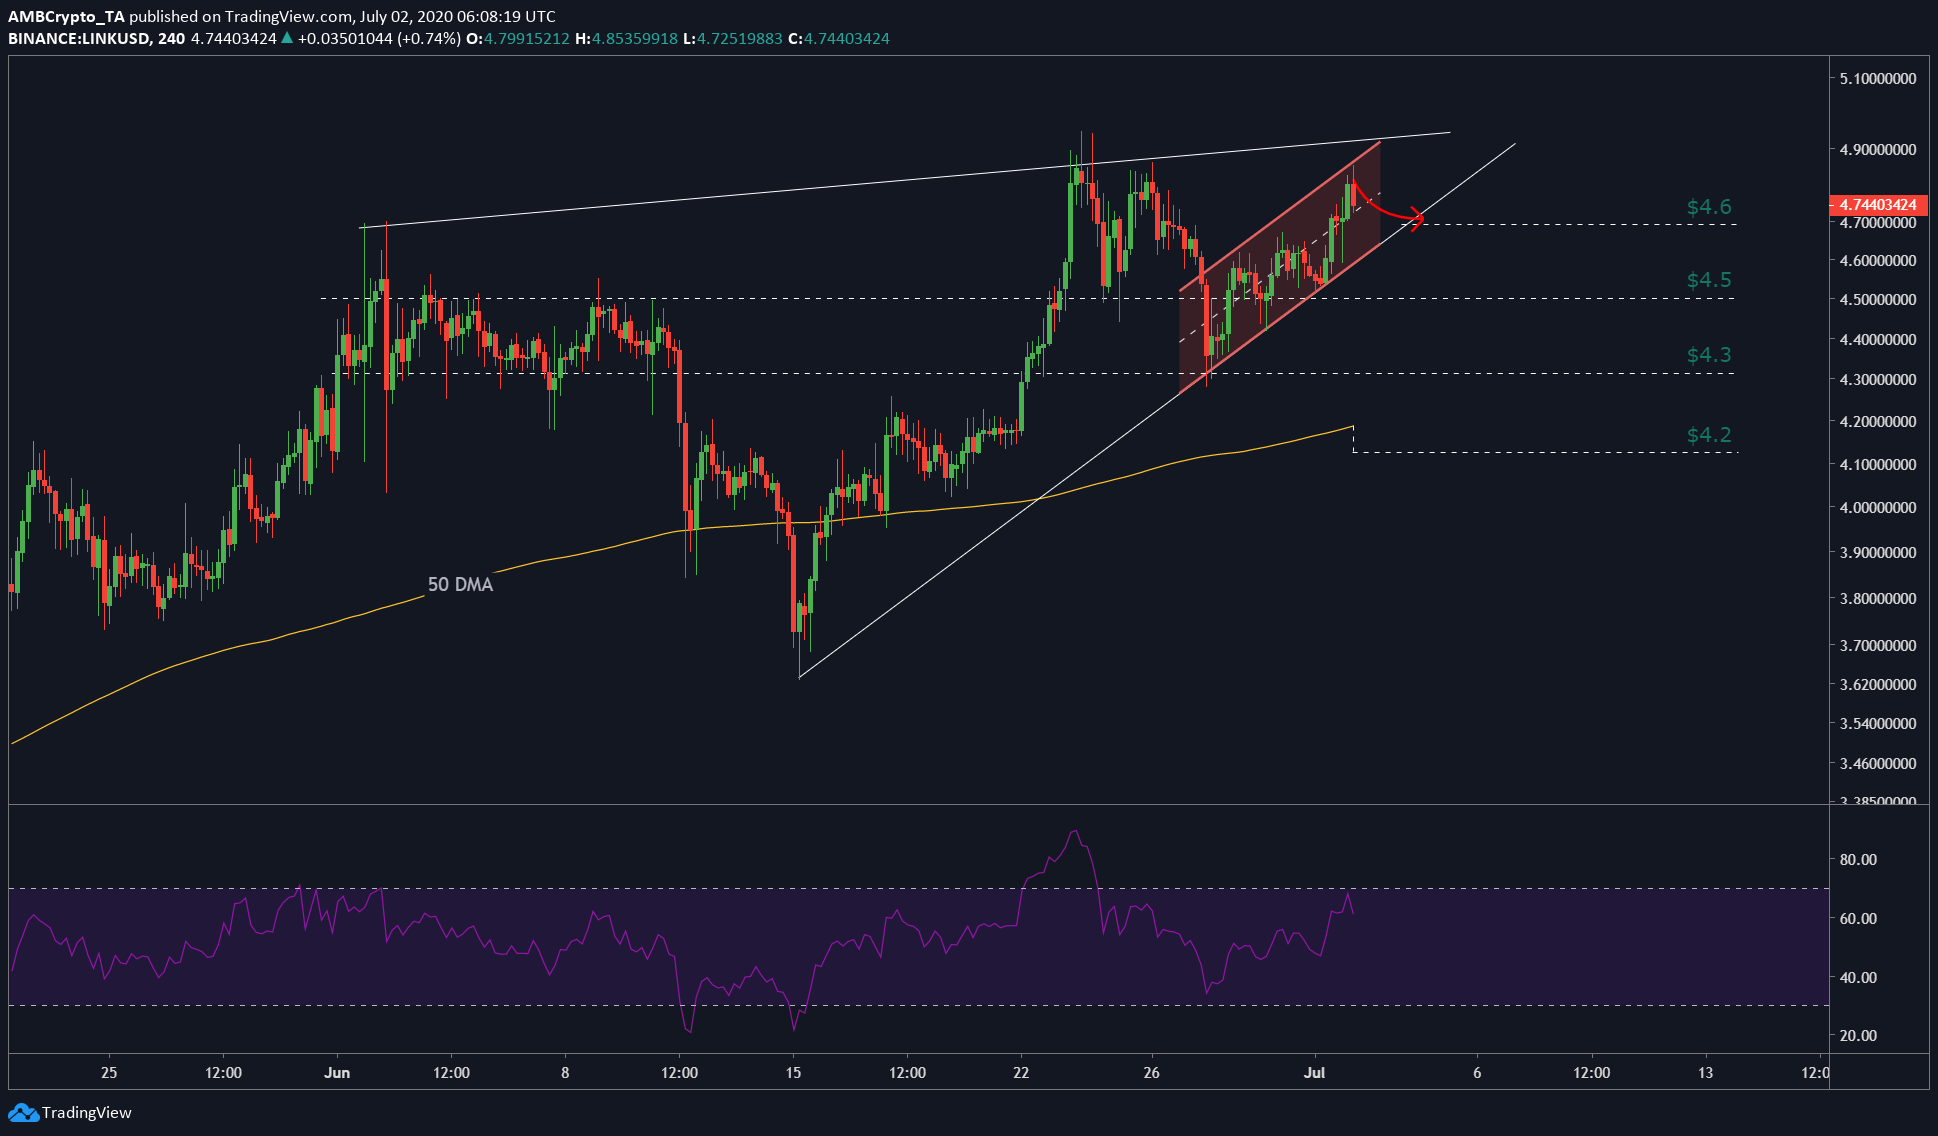
Source: LINKUSD on TradingView
The attached chart pictures two patterns, both of which are bearish. The first pattern is the rising wedge, which was extending from 15 June to 02 July and had a few more bounces to go before the price was to breaks out of this pattern. However, the other pattern, the ascending parallel channel, was much smaller and was extending from the last week of June to 02 July.
Since both the patterns are indicative of a bearish breakout, the price lines noted on the chart are the potential targets, depending on the bearish or the selling pressure in the market. As for the first target at $4.6, this drop will take place as the price bounces within both the aforementioned patterns, still awaiting the breakout.
Following the price drop to $4.6, the breakout will begin; confirming this is the RSI indicator which was already looking toppy, at the time of writing. As the breakout begins, the RSI should start retracing towards the neutral zone; based on the momentum of sellers/buyers, the price will drop to $4.5 and even $4.3, which is a 5% to 9% drop from the press time price of $4.75. Although $4.3 looks unlikely, the possibility of the price retracing should be not be shelved.
In an extremely bearish condition, due to any unforeseen scenario, if the price decides to tread lower than $4.3, then it will be supported by the 50-DMA [yellow] which stood at $4.2, at the time of writing.