
Bitcoin has been seeing a drop in volatility lately, with its price range-bound for a while now. In fact, the extended bear market has also contributed to new entrants emerging less optimistic, and this can be seen clearly when BTC’s maturity charts are observed.
Bitcoin’s tussle with $10,000 & accumulation
Anything above $10,000, particularly $10,500, has been an extremely tedious resistance for Bitcoin to overcome. Since August 2019, BTC has not seen its price head higher than $10,800, ie. it has been almost a year since BTC started trading below $10,800.
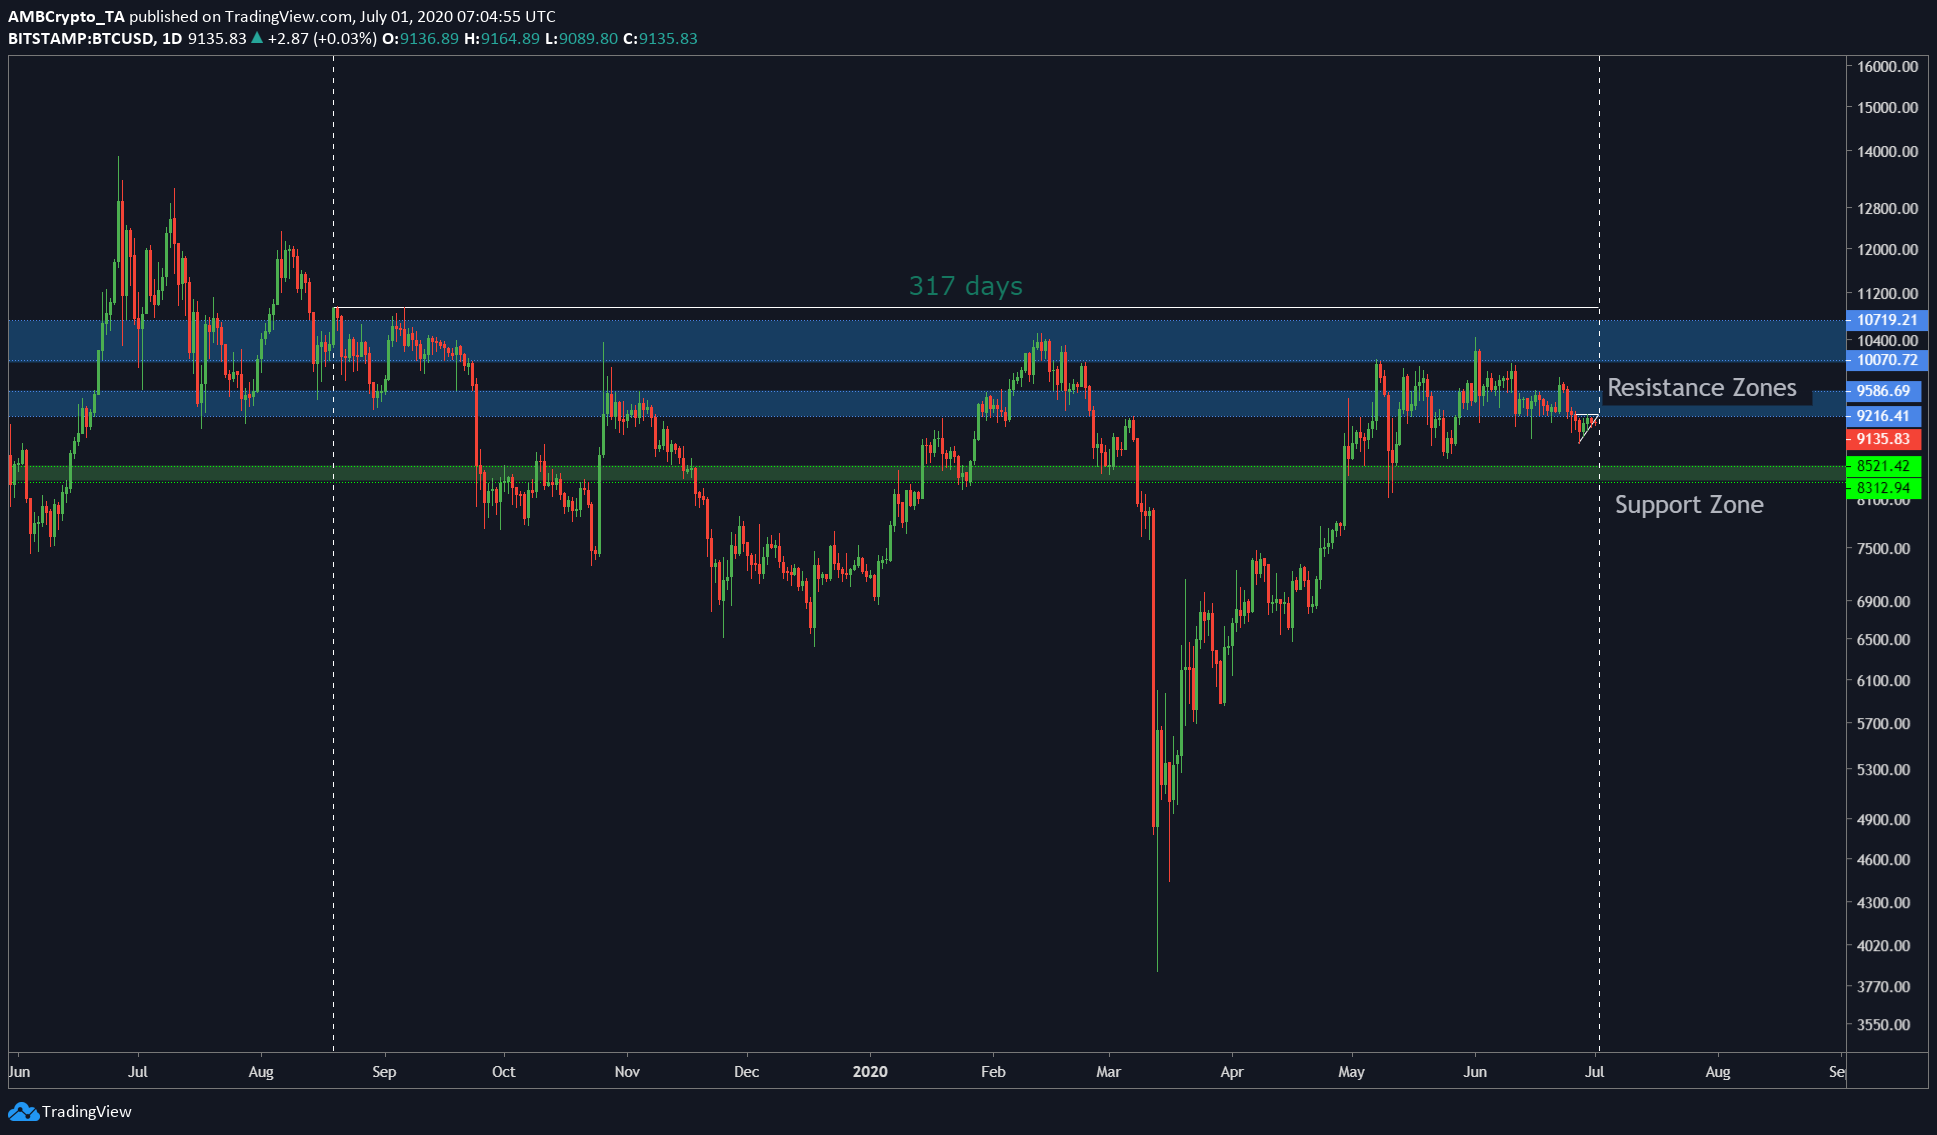
Source: BTCUSD on TradingView
There are two particular resistance zones that have prevented the price from moving higher. Combining these with the global pandemic and its effects, the price of Bitcoin has suffered a massive blow. However, unlike stocks, BTC has recovered to the level it was at before the crash. Additionally, a look at the many times BTC has tried breaching the resistance zones confirms the existence of continuous short-sellers in the market.
Almost two and a half years since the last bull market, the sentiment has gone awry. However, there is a flip side to all the bulls and the resistance zone; this level can now be identified as the accumulation zone.
Before the bull run, there seems to be an accumulation zone wherein BTC moves sideways or with low average volatility. Following this accumulation zone is when the price bursts into a bull run, shattering most resistance zones with ease.
The charts attached herein show the accumulation zone for 2016 that preceded the historic bull run of 2017, while comparing it to the market situation at hand.
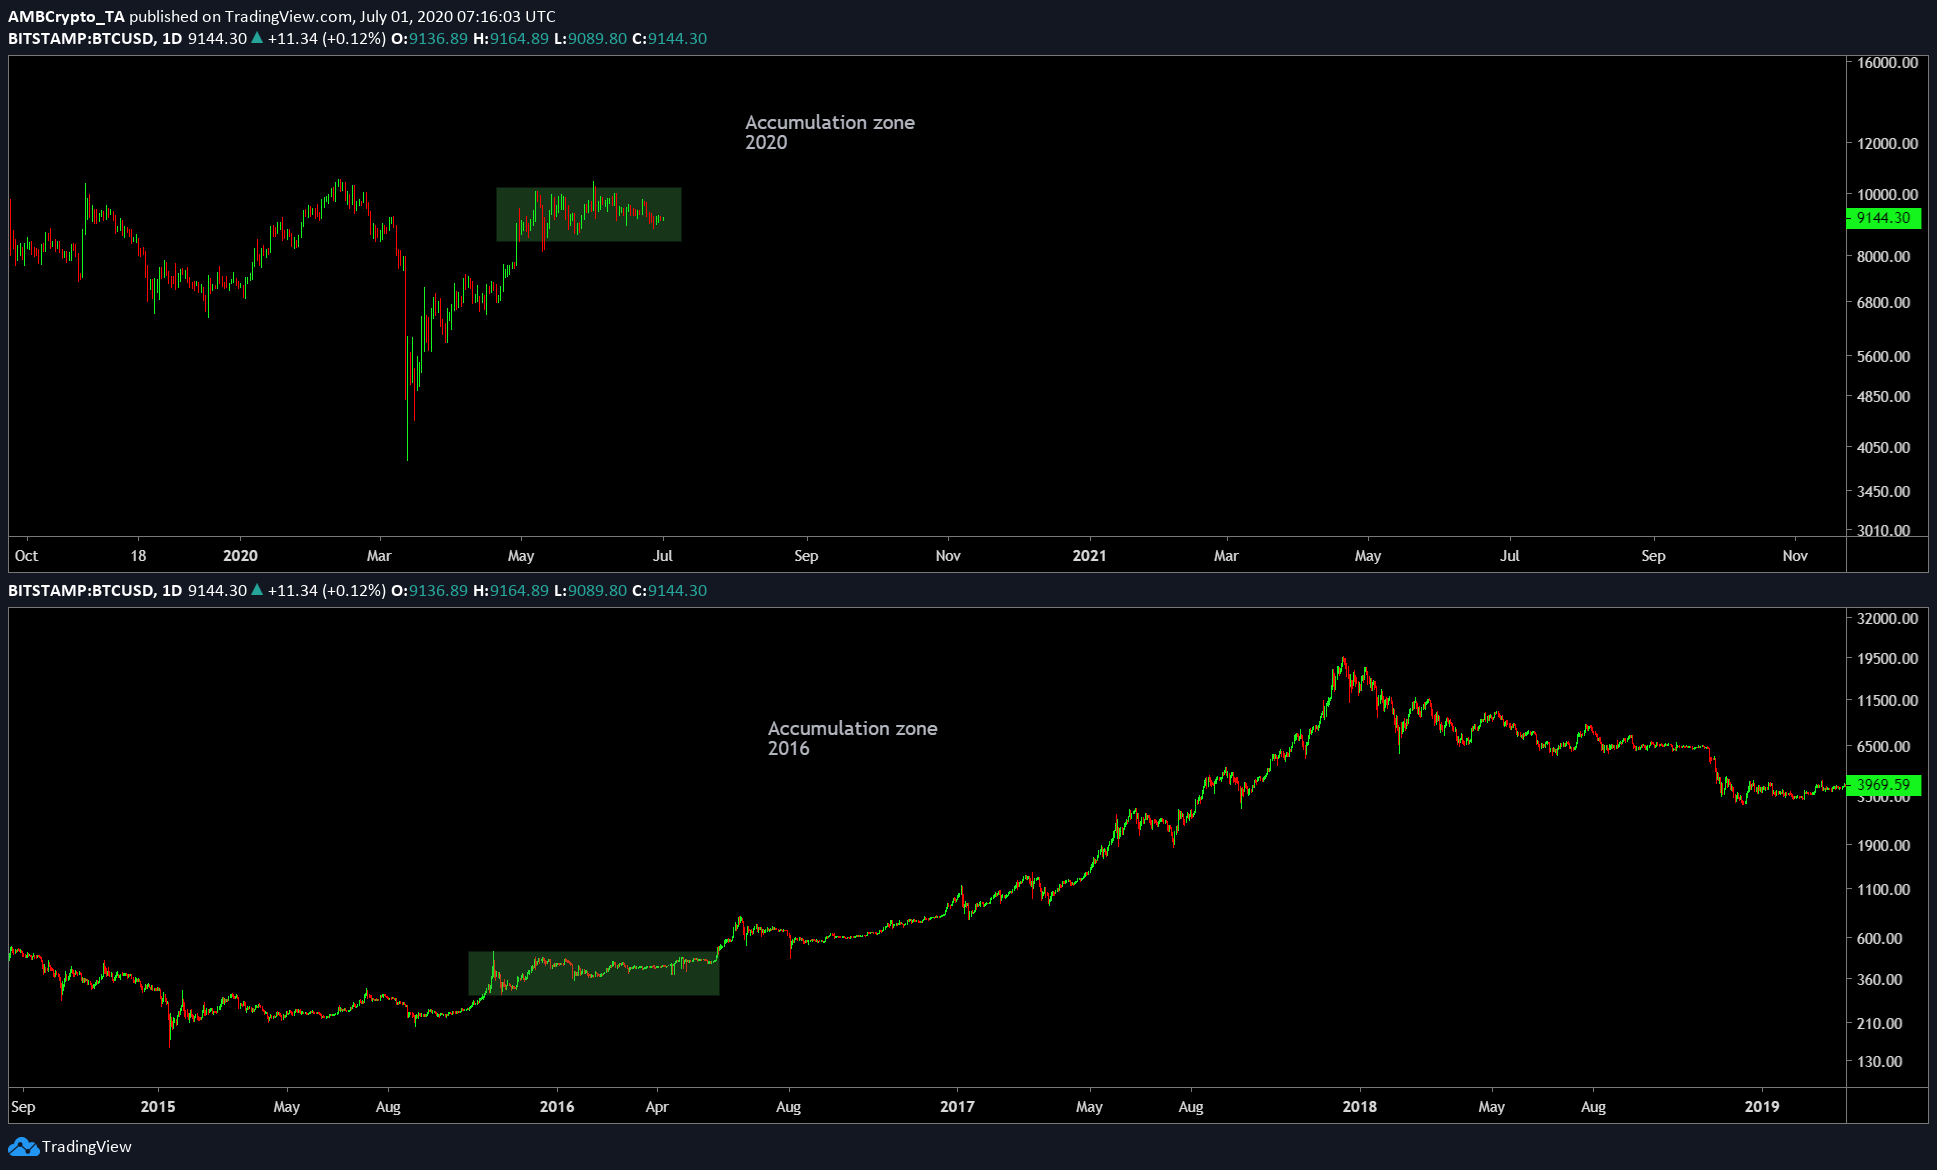
Source: BTCUSD on TradingView
Fear-Greed Index and Volatility
The Fear-Greed index measures the overall sentiment of Bitcoin and cryptocurrencies and is related to the price of Bitcoin. The index points to “fearful” during market crashes like Black Thursday and registers “greedy” during bull runs. The recent crash pushed this index down to levels last seen in December 2019 & 2018, thus showing the sentiment of the crash. At press time, this index was stuck right in the middle, showing a lack of bullish or bearish sentiments in the market.
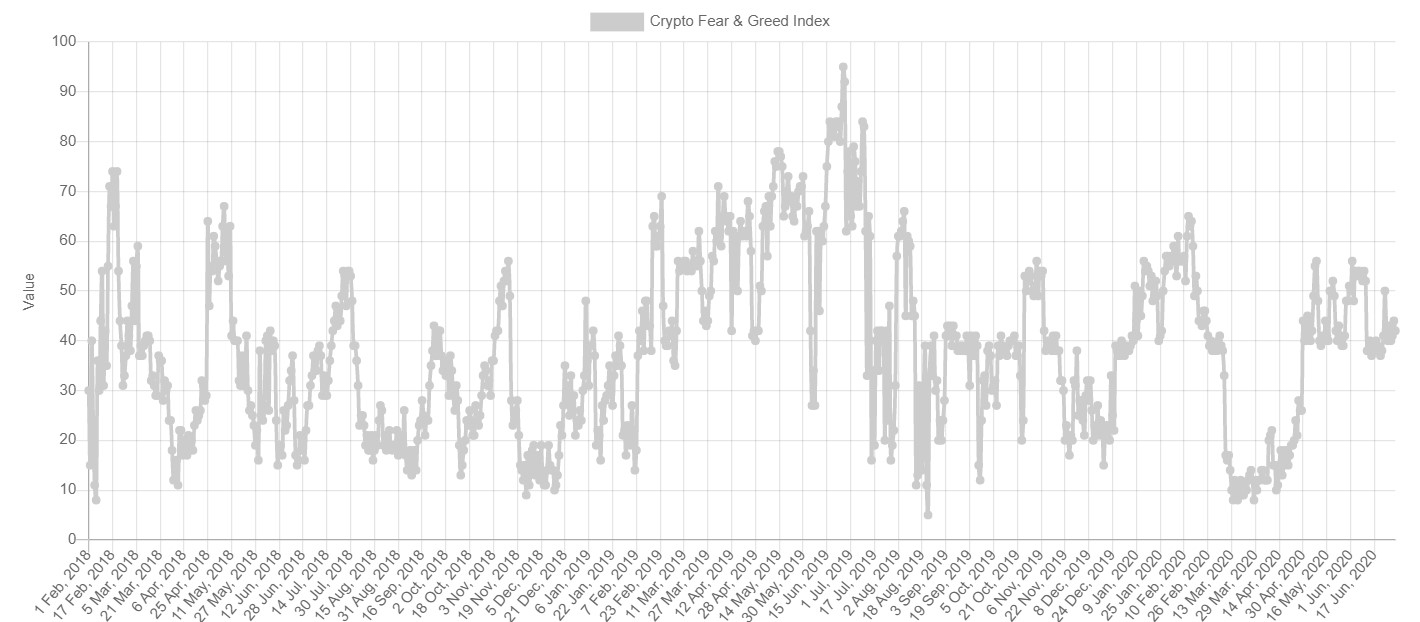
Source: Alternative.me
This is likely due to the lack of volatility and the range-bound trading of Bitcoin’s price, which, in turn, influences every other crypto-asset. The 30-day volatility estimate for Bitcoin was sitting at 2.28%, at the time of writing, the likes of which were last seen in the first quarter of 2019, and more precisely, in 2016, the start of the bull run.
Often, a majority of the people are on the wrong side of the trade and only come in at the end due to FOMO. Hence, Warren Buffett’s popular adage is as relevant as ever,
“Be fearful when others are greedy, and be greedy when others are fearful.”
It is also clear that the number of people hodling Bitcoin has reached historic levels. Perhaps, these are the people who have experienced the bull run and have researched enough to know that a bull run may be around the corner.


![Real-world assets [RWA]: How to invest in Gold & Real Estate on-chain](https://eng.ambcrypto.com/wp-content/uploads/2026/02/Samyukhtha-5-400x240.webp)