Chainlink reached an ATH of $20 in August and could be set to slowly grind downward in the coming weeks. On a shorter time frame as well, the path of least resistance for LINK was to the downside. EOS was consolidating above a level of support. FTX Token could be set to trade within a range in the coming days, as its imminent levels of support and resistance stayed unbroken.
Chainlink [LINK]
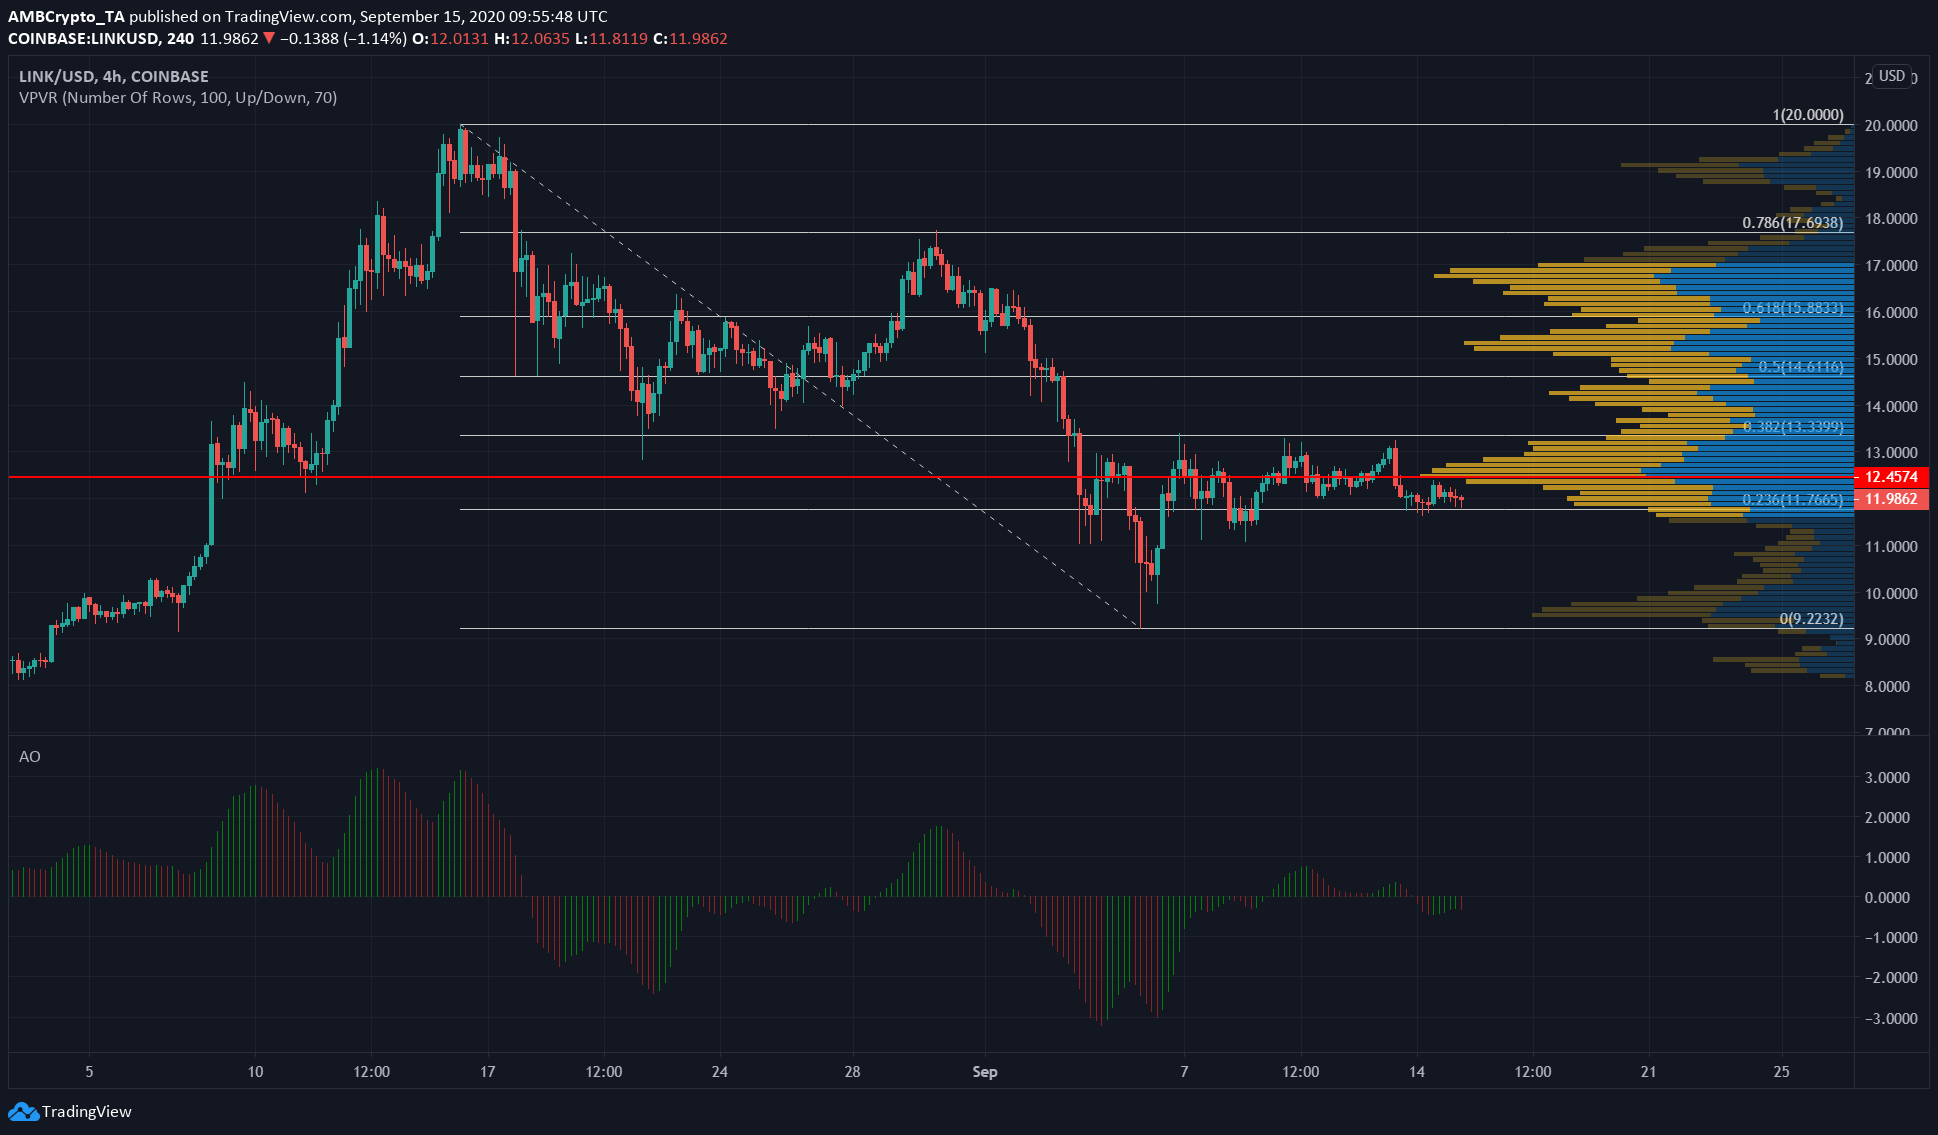
Source: LINK/USD on TradingView
As shown by the Fibonacci Retracement tool, LINK retraced 23.6% of the move down from $20 to $9.22. Chainlink was valued at $11.98 per token at the time of writing and was just above $11.76 level.
$11.76 is an important level because it also represents the 61.8% retracement of LINK’s move upward from $9.22 to $13.4 on its recent bounce.
If LINK loses this level, it could plummet toward $9.5. VPVR showed a lack of significant trading activity from the $11.6 region to a $9.5 region. This meant price is unlikely to stay for long in between the two levels.
EOS
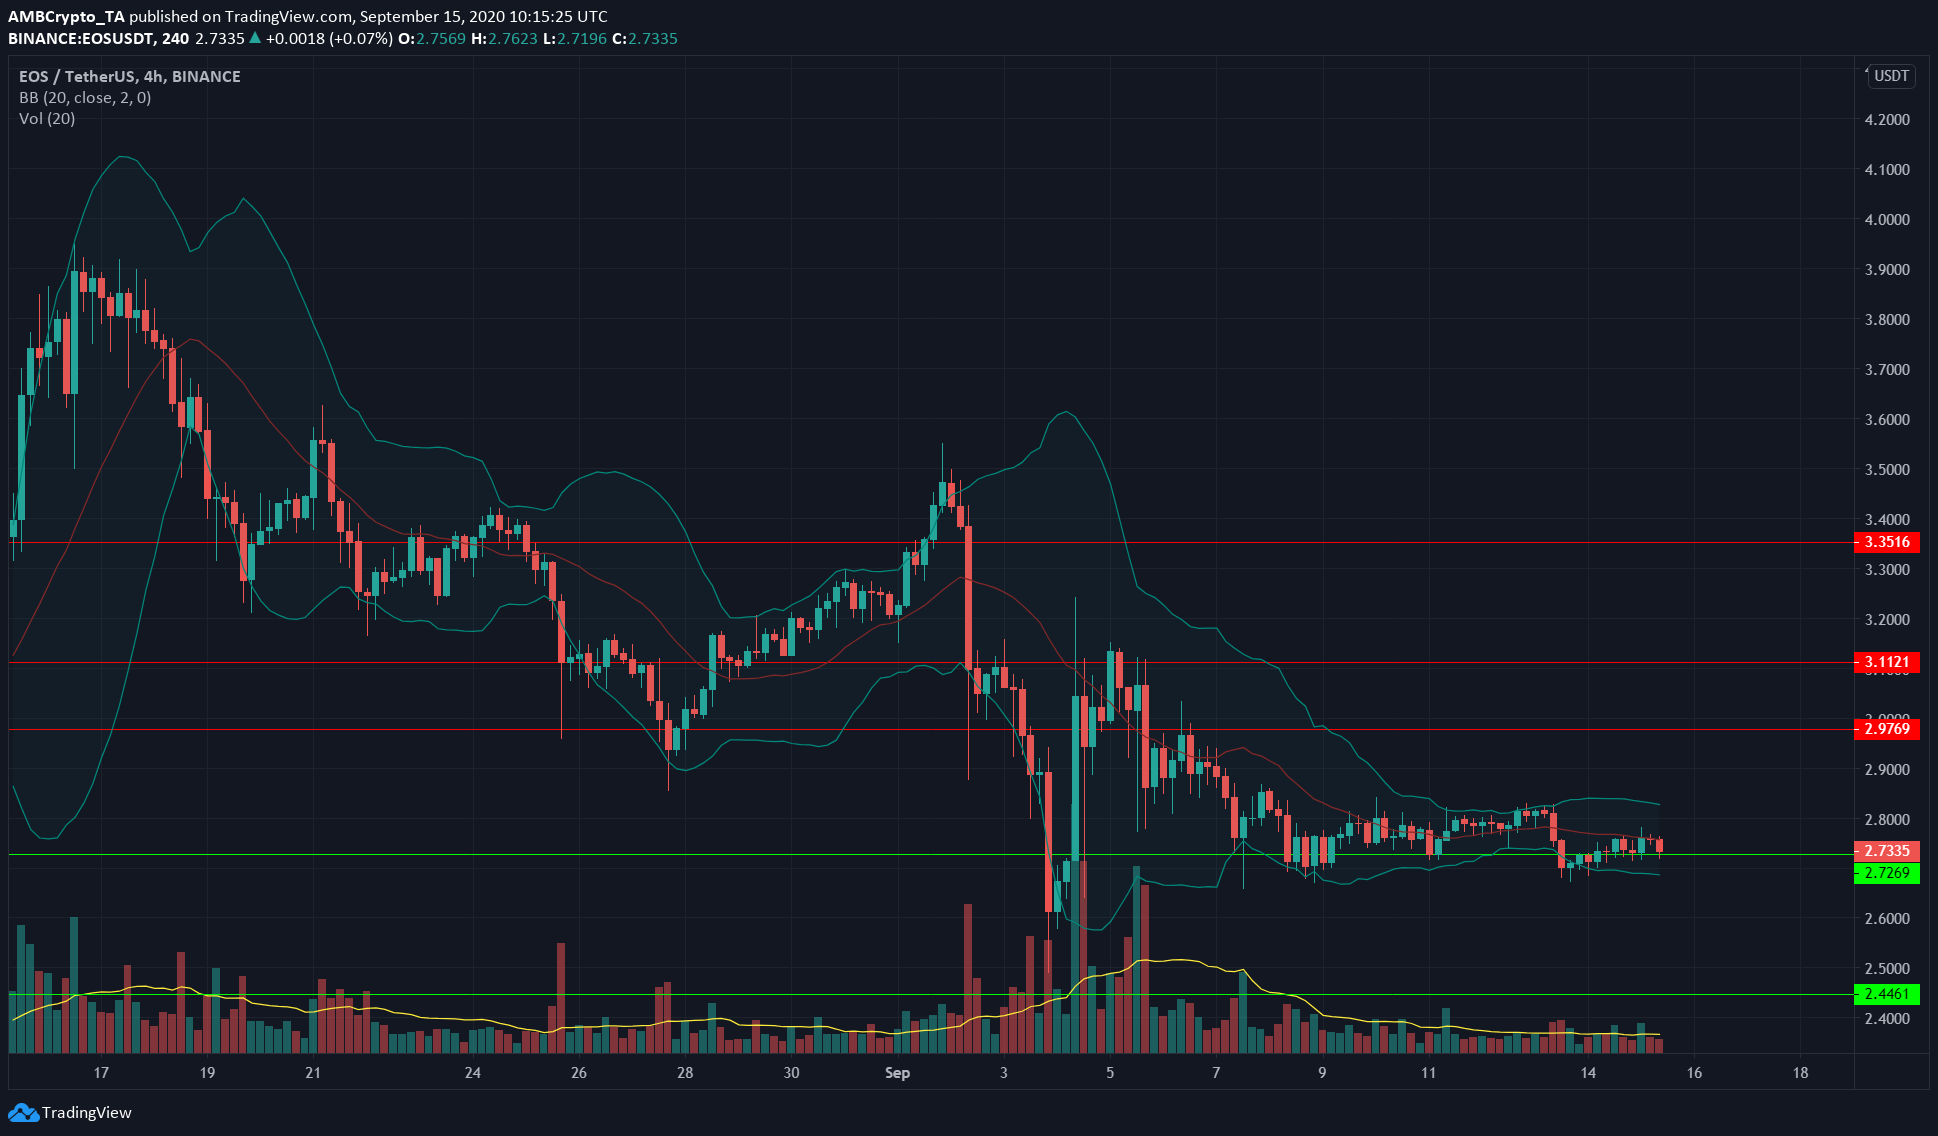
Source: EOS/USDT on TradingView
EOS was the 12th largest cryptocurrency by capitalization, with a market cap of $2.5 billion. It was trading above a significant level of support at $2.72. Bollinger bands squeezed around EOS, while trading volume was also subdued. This showed a period of consolidation in the market.
The next major move of Bitcoin or Ethereum could trigger a break out upwards or downwards for EOS. This will be confirmed by expanding Bollinger bands, as well as increased trading volume.
EOS has tested support multiple times in the past few days, forming lower highs each time. This price action could forecast a break beneath support in the coming days.
FTX Token [FTT]
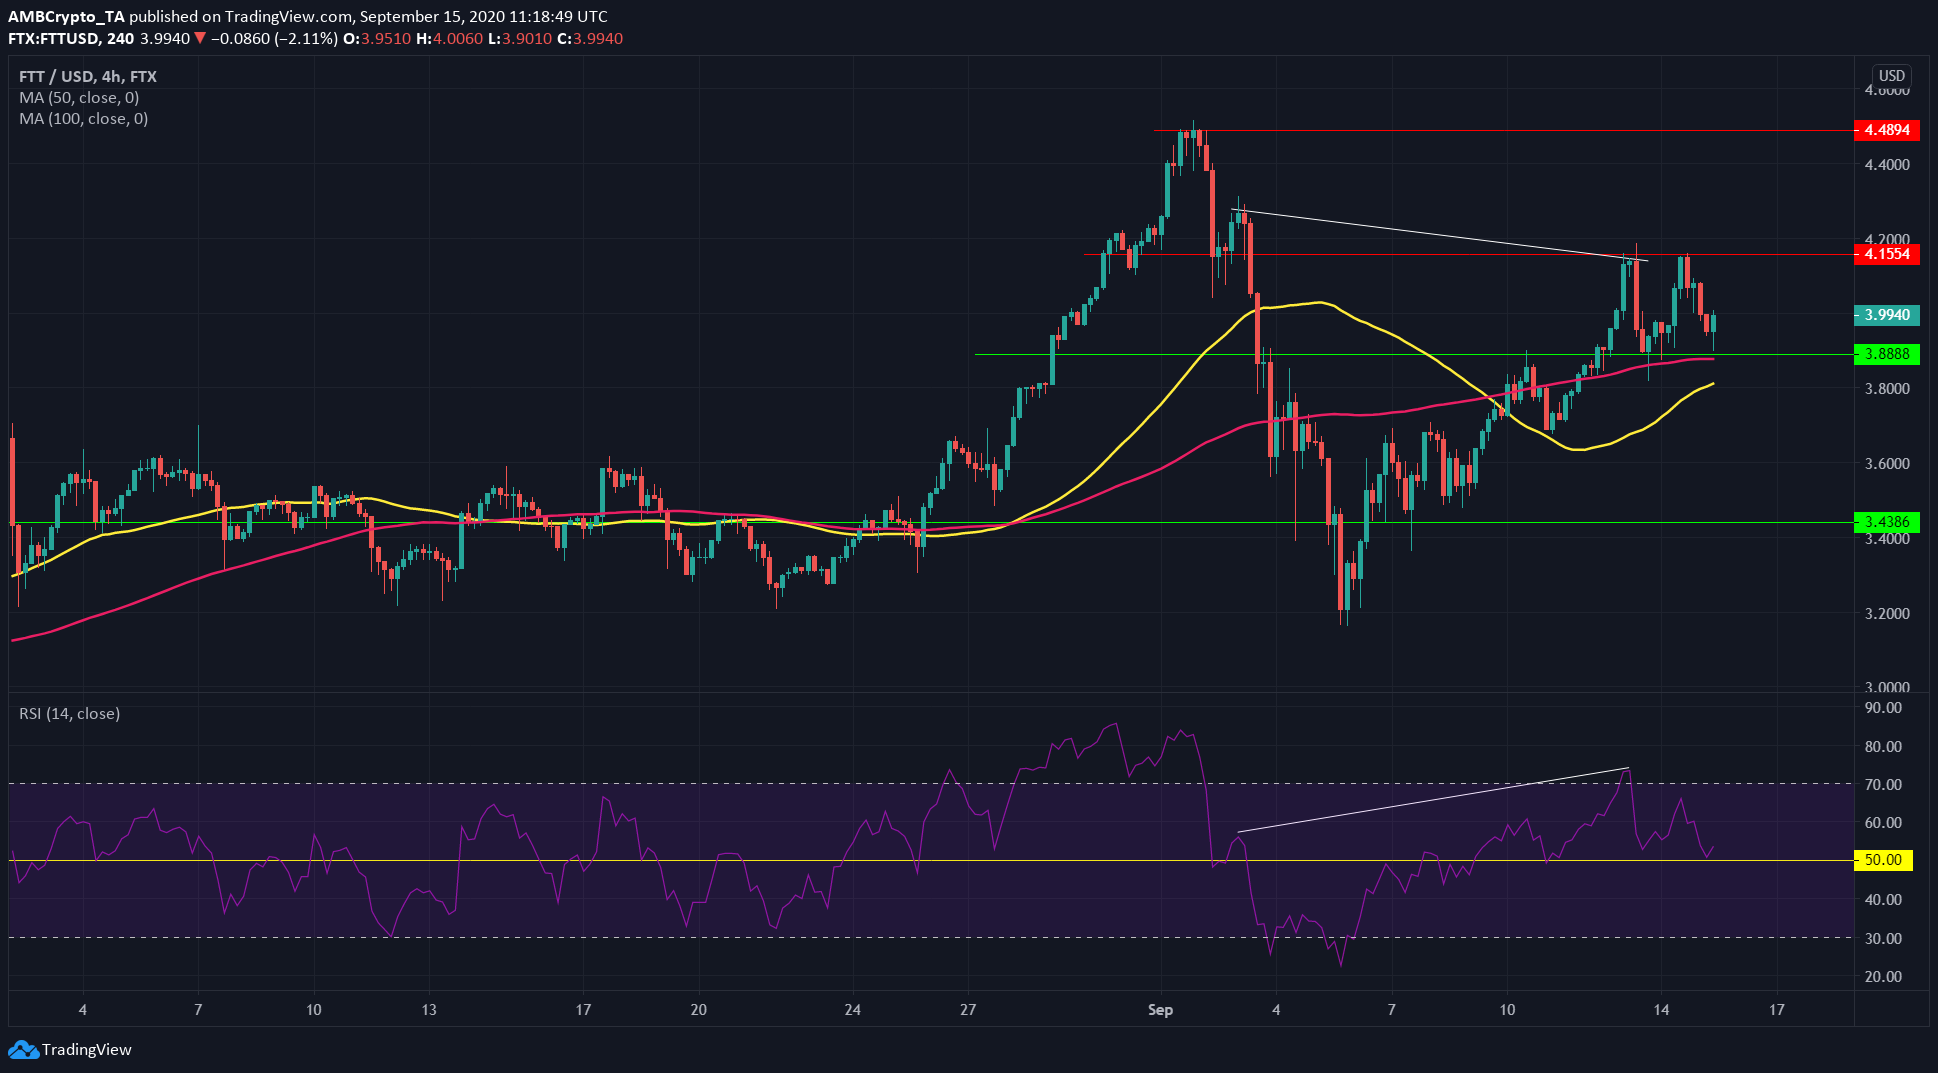
Source: FTT/USD on TradingView
FTT had a level of support at $3.88, which coincided with 100 SMA (pink) to form a strong level of support.
FTT displayed a bearish divergence a few days ago, highlighted by the white trendlines. This prompted a drop in the asset’s value, but it recovered almost as quickly. It got rejected at $4.15 resistance again. This might indicate that price is likely to oscillate between the two levels.