Cardano, Monero, VeChain Price Analysis: 17 November

Bitcoin touched a high of $17,081 at press time and large-cap altcoins performed remarkably well in recent days as well. Cardano and Monero broke strongly upward out of a downtrend, while Vechain pulled off the same feat.
Cardano [ADA]

Source: ADA/USDT on TradingView
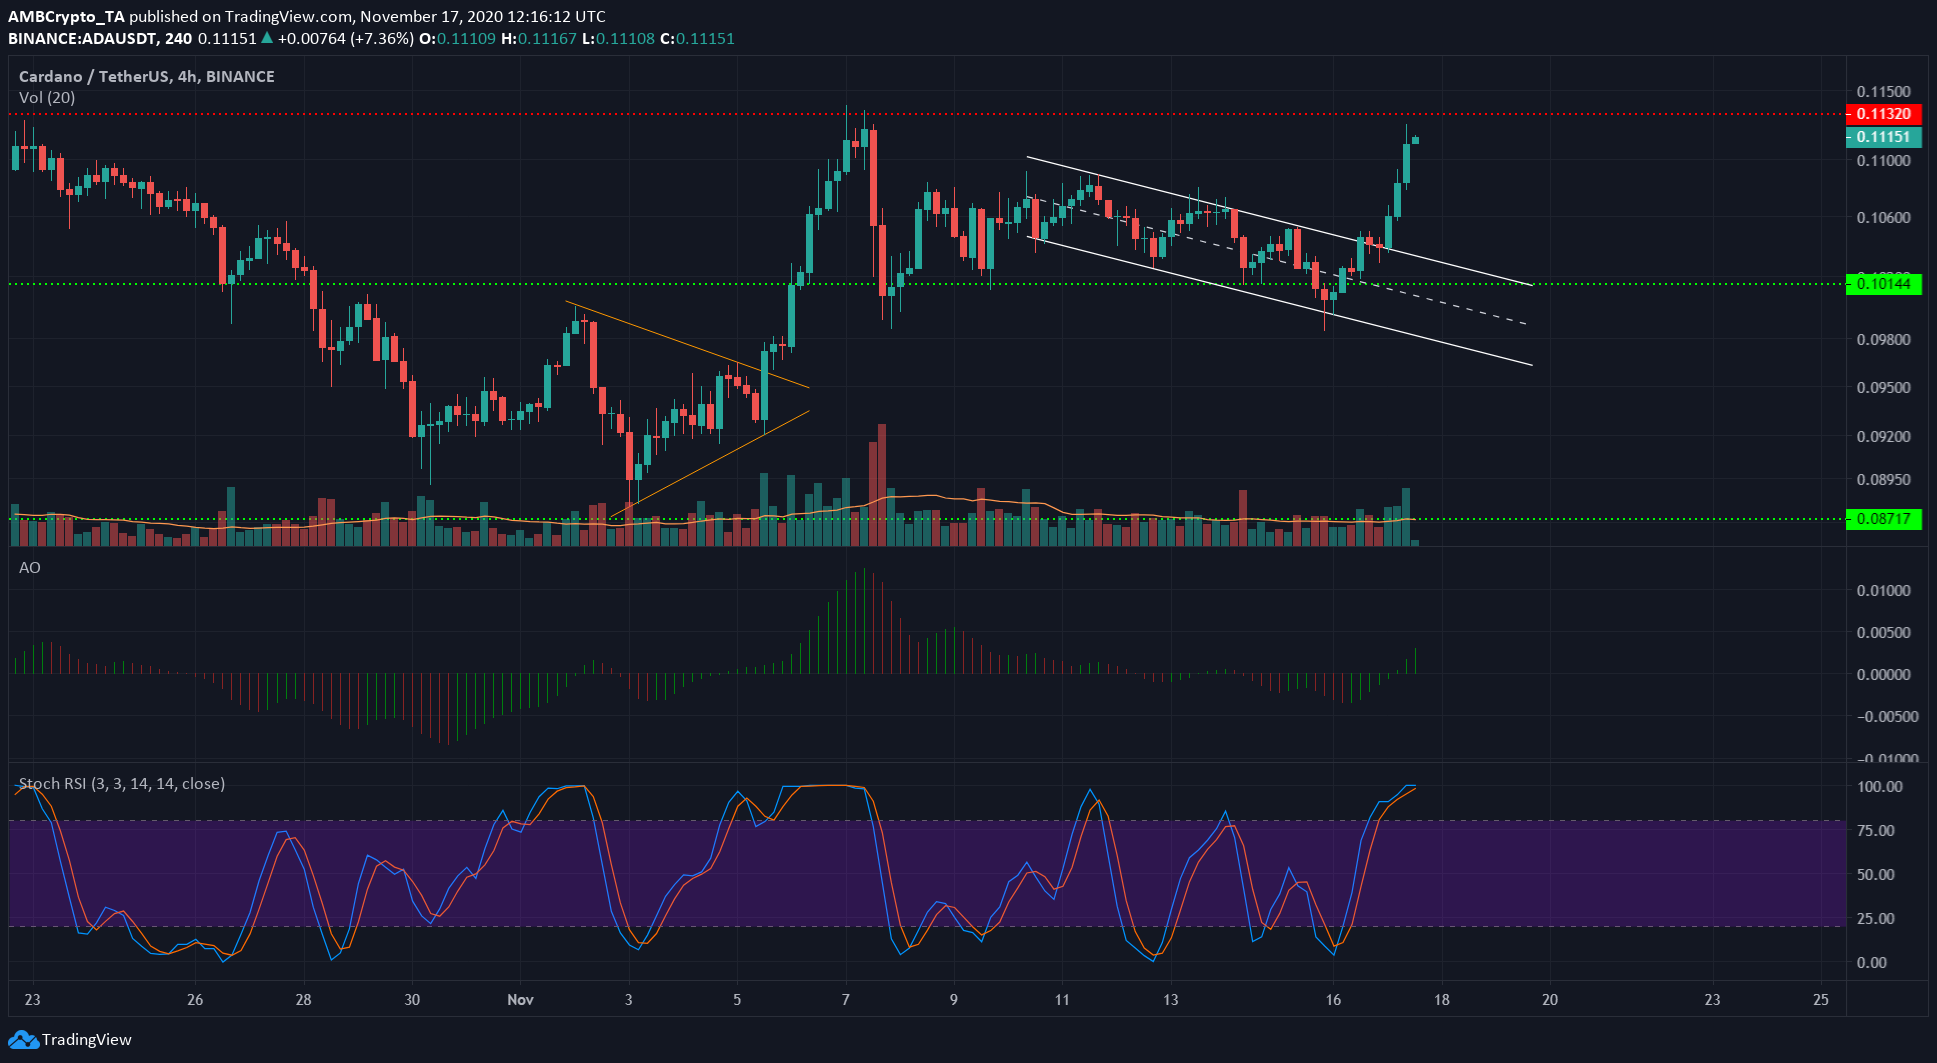
Cardano surged off the $0.1 support and broke past the descending channel’s upper boundary. The Stochastic was in the overbought zone but that does not indicate an immediate pullback for ADA.
It was more likely that ADA would test, and possibly even flip, the level of resistance at $0.113 in the next day or two. Bitcoin could also influence Cardano’s price movement, as a heavy BTC correction could see metaphorical blood on the streets.
The Awesome Oscillator moved into bullish territory and signaled further gains to be made. The trade volume upon breakout has also been far above-average, reinforcing a bullish short-term outlook.
Monero [XMR]

Source: XMR/USDT on TradingView
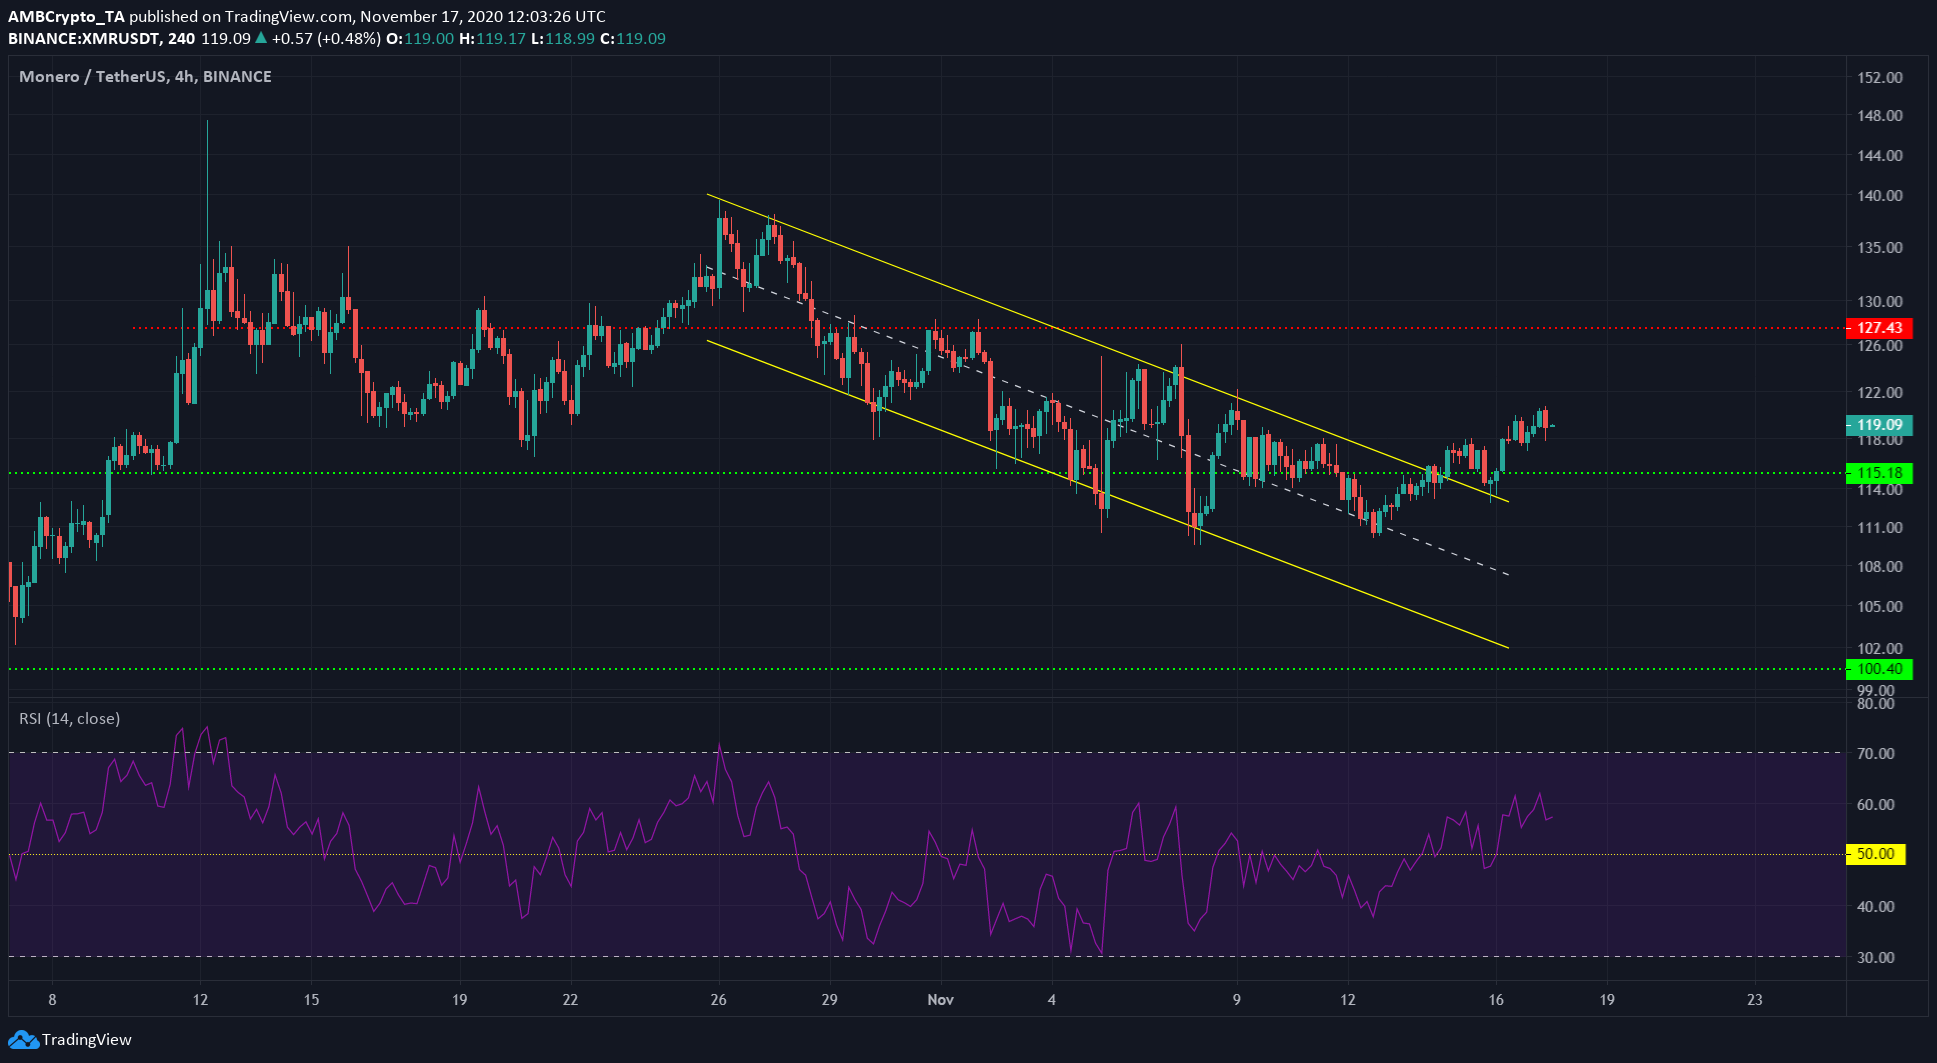
Monero closed outside a descending channel (yellow) it was trending downward within. The price also defended the crucial level of support at $115, as a move toward $100 could have spelled trouble for bulls.
The price was at $119 at the time of writing, and channel breakouts generally project a target near where the channel was entered. Hence, XMR could target $127 resistance in the coming days.
The RSI also showed an uptrend in progress as it did not dip significantly below the neutral 50 line and moved upward to indicate bullish momentum.
VeChain [VET]

Source: VET/USDT on TradingView
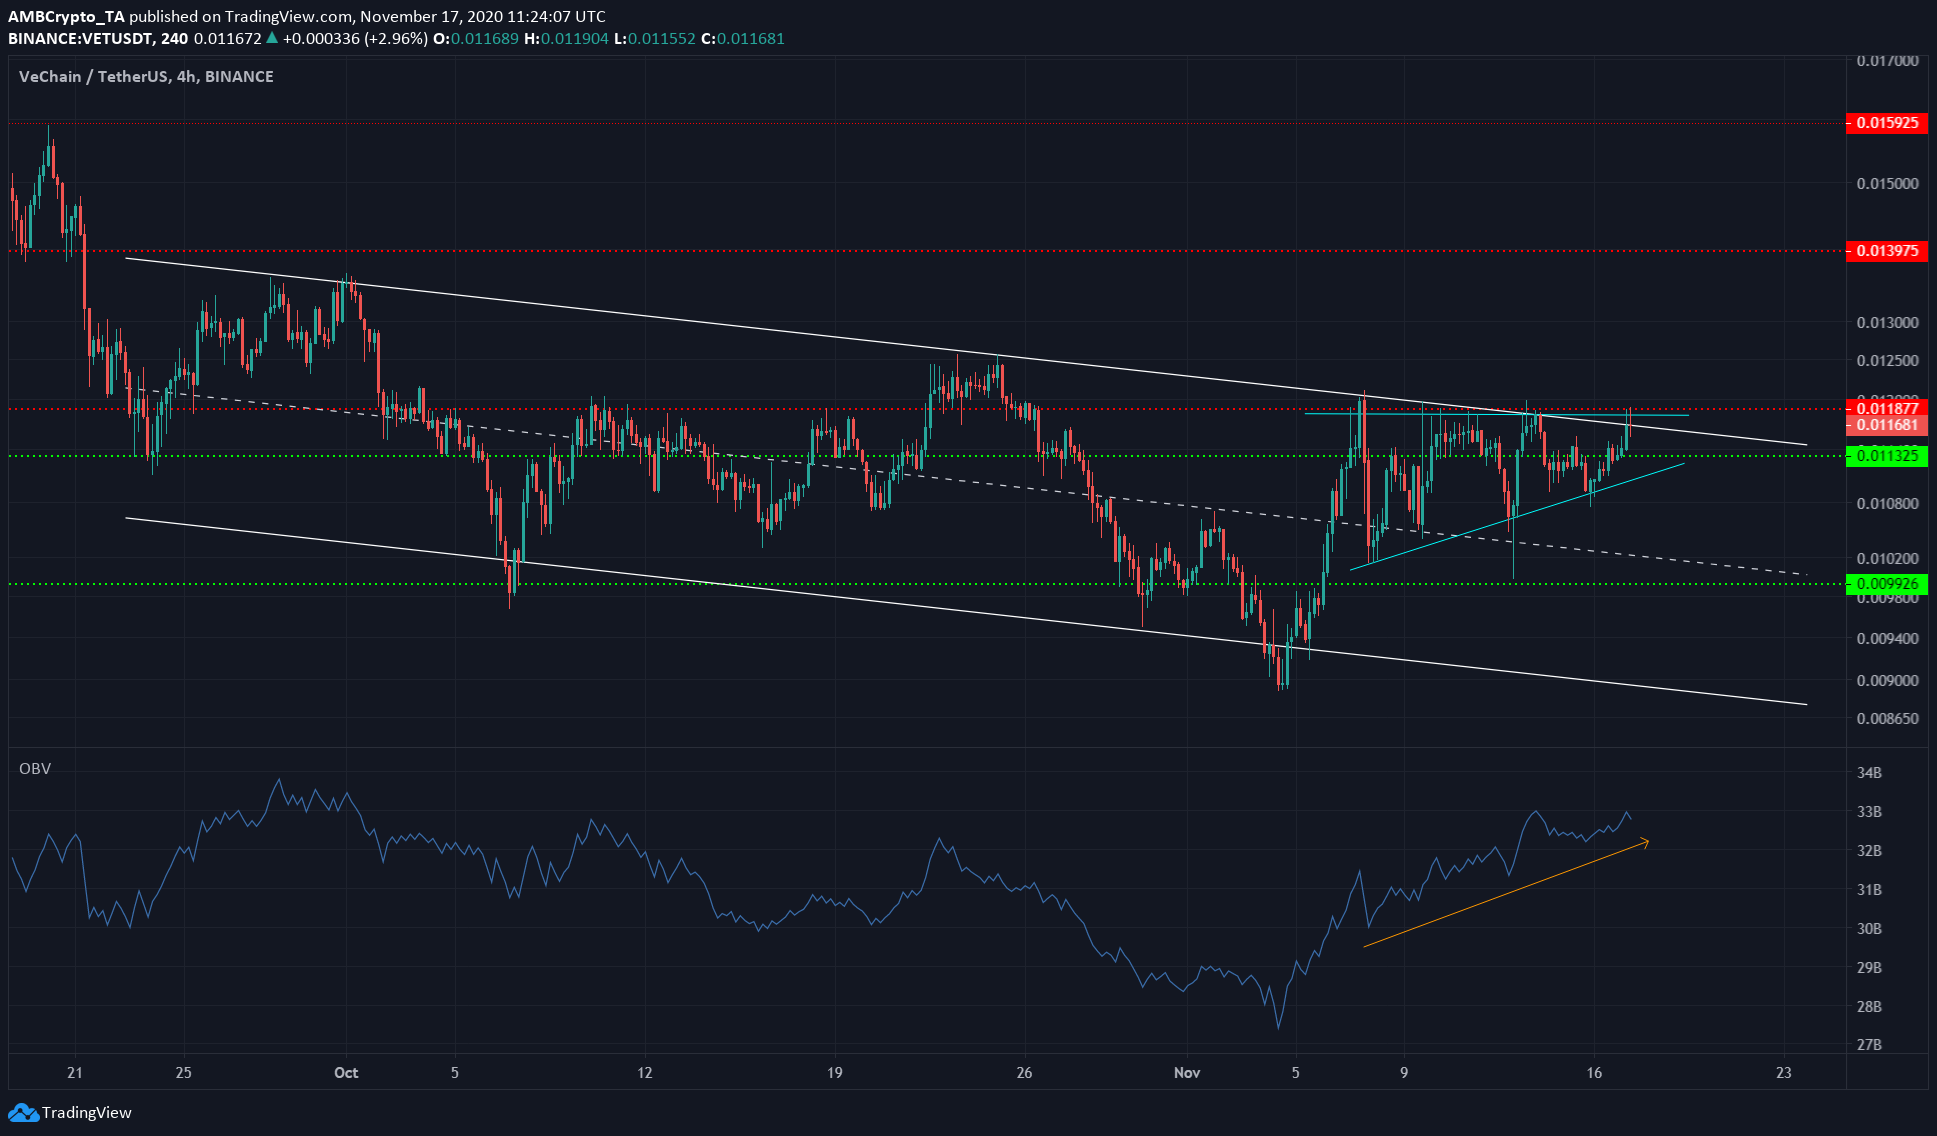
VeChain was trading within a descending channel (white) and has tested the upper boundary of the channel twice in the past few days. Another, shorter-term pattern emerging was the ascending triangle (blue) that indicated a possible breakout to the upside for VET.
The price was also above the $0.01 level, which has been one of the most significant levels for VET in the past two months.
The OBV also showed rising buying volume in the past week.
Hence, the conclusion was that VET was likely to see a break to the upside. A trading session close above the descending trendline, followed by a retest of the same and a move upward, can be expected for VET.
A close below the triangle pattern would see VET test support at $0.01 and even drop further.


