
Cardano has been the pick of the altcoins since Bitcoin crashed in March. The now seventh-largest cryptocurrency in the market has amassed market capitalization of $3.1 billion, ahead of another rapidly surging altcoin Chainlink, market cap $2.74 billion. ADA trails Bitcoin Cash and its hardfork Bitcoin SV, in fifth and sixth positions respectively, but given Cardano’s price performance, the latter’s position may be threatened.
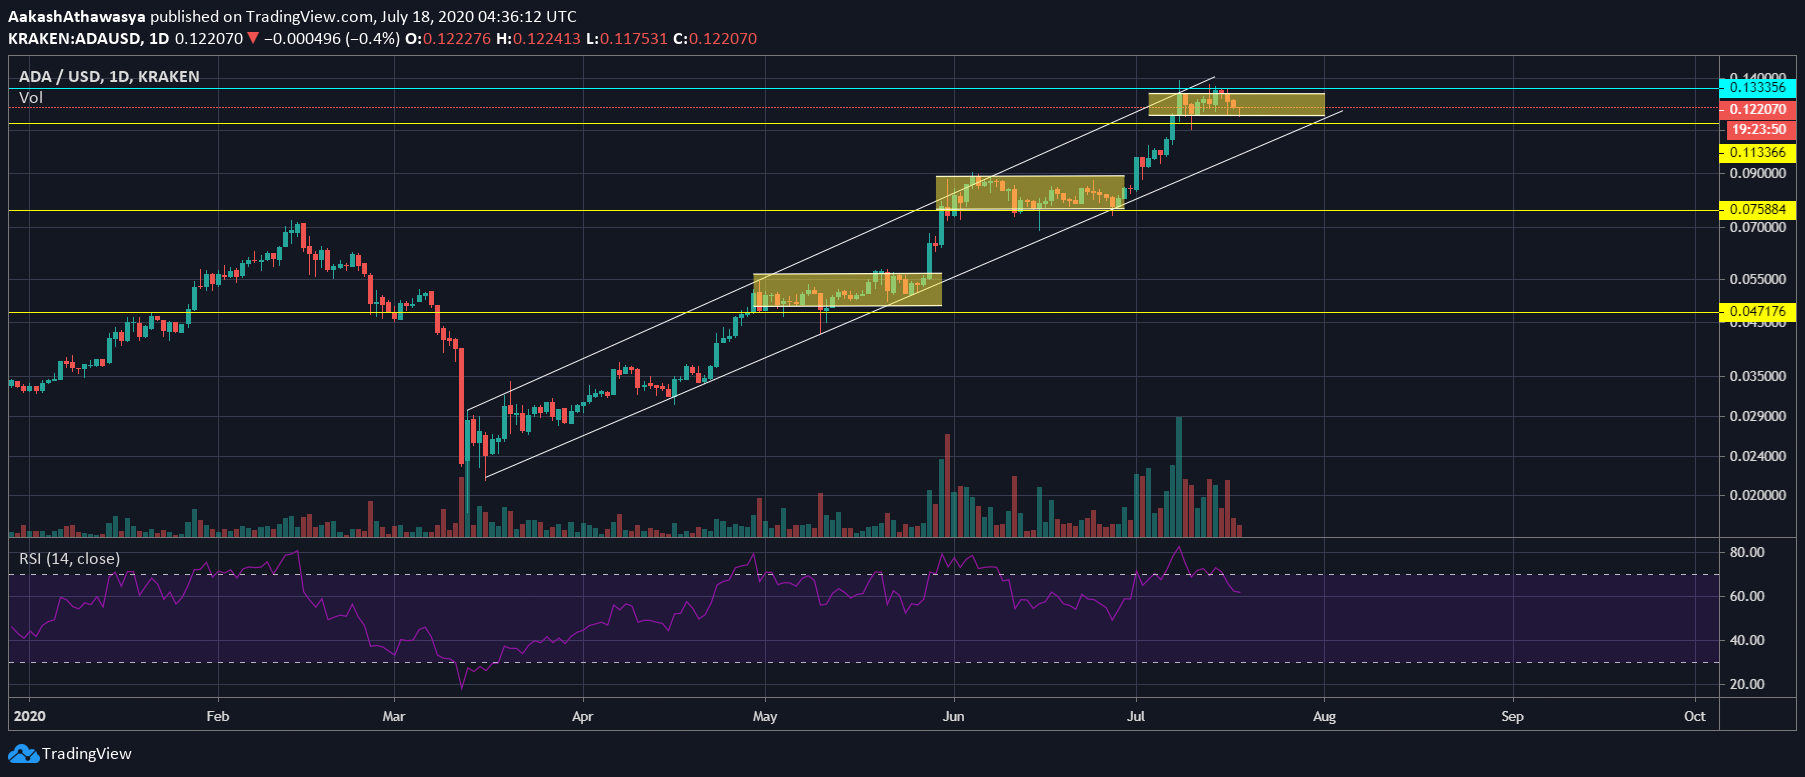
Looking at the long-term daily chart of Cardano, the upward channel persisting since March is still holding strong. Since reaching a high of $0.13, ADA has seen relatively sideways movement over the past two weeks but still remains within the left of the channel. Given the rapidity of its price increase, the lower-bound of the channel is still quite a long way off its current price. On the current trajectory, even if the altcoin trades within $0.12 to $0.13 for the next two weeks, the channel will remain unbroken.
On the basis of previous movements, a sideways period should be expected. The channel has been prevalent since March 2020, when ADA dropped to $0.021, and it has pushed the altcoin’s price up by 465 percent in the past four months. However, this has not been a straightforward increase, in fact, it can be broken into three phases, with each phase interrupted by what is happening in the ADA markets now – sideways movement.
Source: ADAUSD via Trading View
From March to mid-May, ADA surged from $0.021 to $0.047, followed by the first parallel sideways channel, during this time the price range lasted between $0.047 to $0.055. The second pump lasted less than four days, as the price climbed from $0.055 to $0.075 followed by sideways movement from $0.75 to $0.11 which persisted till July. In the first week of July the price moved from $0.089 to $0.11 and now is trading in its third sideways parallel channel in the past few months.
The Relative Strength Index for the altcoin is now slipped back into the healthy zone, with a value of 60.54. Last week the RSI jumped to as high as 85, its highest point in the past 6 months. If the RSI holds above 50, which it was last below only in May, it’s a sign of investor confidence in ADA not decreasing.
As things stand, Cardano is in for sideways movement, which is likely to bounce between the support at $0.11 to the resistance at $0.133, as the current price lies at $0.12. If we go by historical patterns, sideways movement is unlikely to result in a pullback, but this could happen if the volume is depleted and the investor confidence drops below 50 as per the aforementioned RSI.