
The cryptocurrency market has been trying to breakout from the bearish price movement that began on 24 September, a day which saw a majority of the tokens including Bitcoin, Ethereum and XRP bleeding by double digits. Since then, whatever the coins have gained has been neutralized by a wave of market corrections.
Cardano, the 12th largest cryptocurrency by market cap, was no different. Cardano was trading at $0.0388 at press time, with a minimal gain of 0.26% on the 24 hour price chart. Interestingly, Cardano had looked set for a bullish burst on 30 September, in the short term.
12-hour price chart
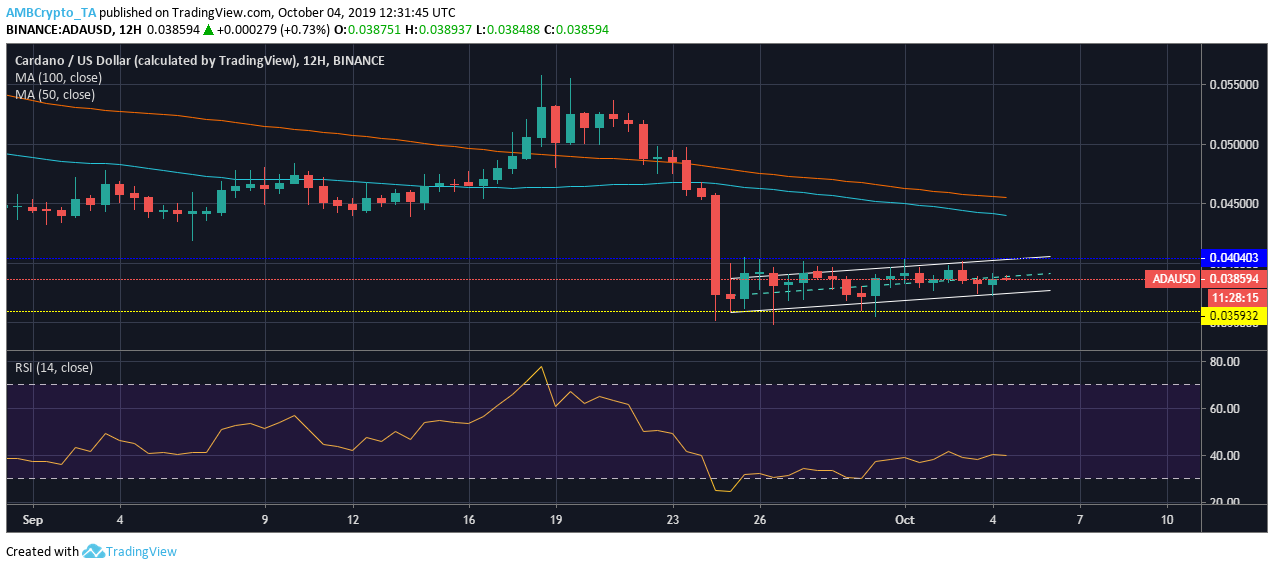
Source: ADA/USD on TradingView
The 12-hour price chart for ADA was looking bearish, with an ascending channel formation seen. The ascending channel was characterized by two parallel lines with higher highs forming at $0.0398, $0.0399 and $0.0400 and higher lows at $0.0357, $0.0373 and $0.0374. An ascending channel is often followed by a bearish price breakout, which means that ADA can see a decline in prices once it moves out of the channel.
The 50 moving average has been moving under the 100 moving average for the most of the year, which suggested the overall momentum being bearish. The RSI indicator painted a similar picture and showed that the sellers had an upper hand ever since 24 September’s massive fall.
24-hour price chart
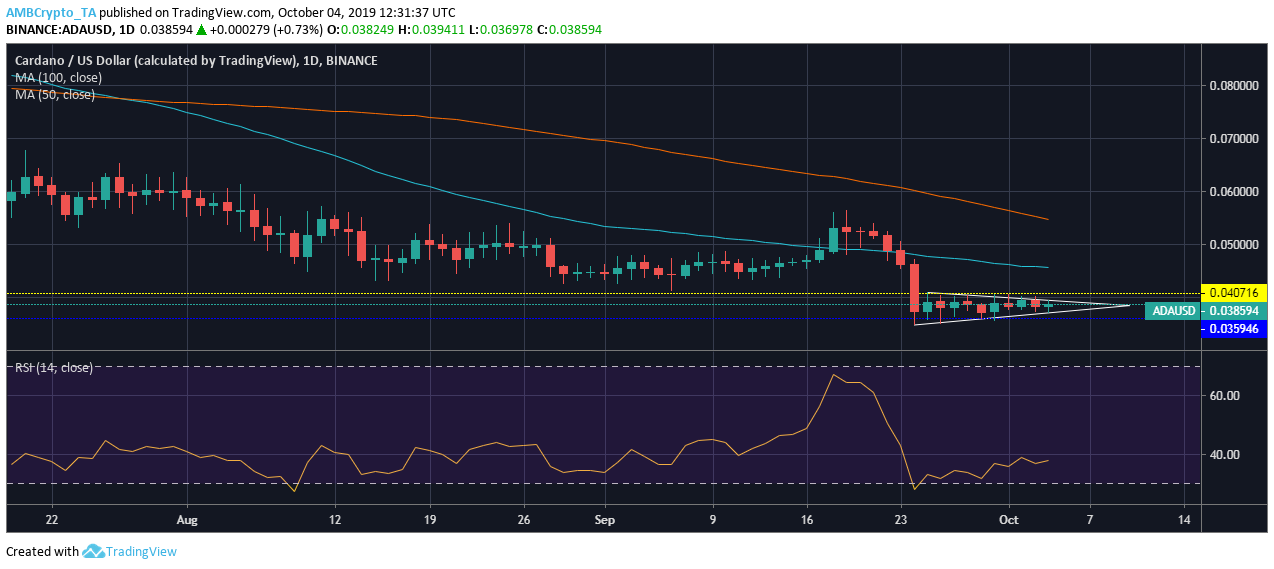
Source: ADA/USD on TradingView
On the 24-hour price chart, ADA formed a symmetrical triangle which was characterized by the formation of lower highs at $0.0408, $0.0405, and $0.0394, with the higher lows forming at $0.0350, $0.0359, and $0.0373. The formation of a symmetrical triangle can be followed by a price breakout in either direction. However, the 50-day moving average was well below the 100-day moving average, which indicated bearish momentum being more prominent than a bullish one.
The RSI indicator looked bearish as well, with the sellers having an upper hand since 24 September.
Conclusion
Cardano looked bearish in the long term as the 12-hour price chart saw the formation of an ascending channel, with the probability of a bearish price breakout, while the 24-hour chart saw the altcoin forming a symmetrical triangle which has a probability of price breakout in either direction. However, the RSI indicator showed that the selling pressure has been high since 24 September.