Bitcoin’s trading intensity is not dead yet

Bitcoin has not looked back since it surged over $10,000 almost a week ago. Trading at close to $11,500 a pop, the cryptocurrency’s highest price since September 2019, the market is rife with immense trading activity. Thus the question arises – is it likely to sustain?
While some would say that this rise from $9,500 to $11,500 in under a week is too quick and fast to sustain, others contend it was on the cards for the past two months. Since May 2020, Bitcoin had been locked in a tight trading channel, despite the grim macroeconomic situation, its block halving, and stock markets trending downwards.
Besides a brief move over $10,000 in early-June, the cryptocurrency was trading flat and the 26 July move allowed it to not only break out of its low-momentum channel, but spurred a wave of intense trading.
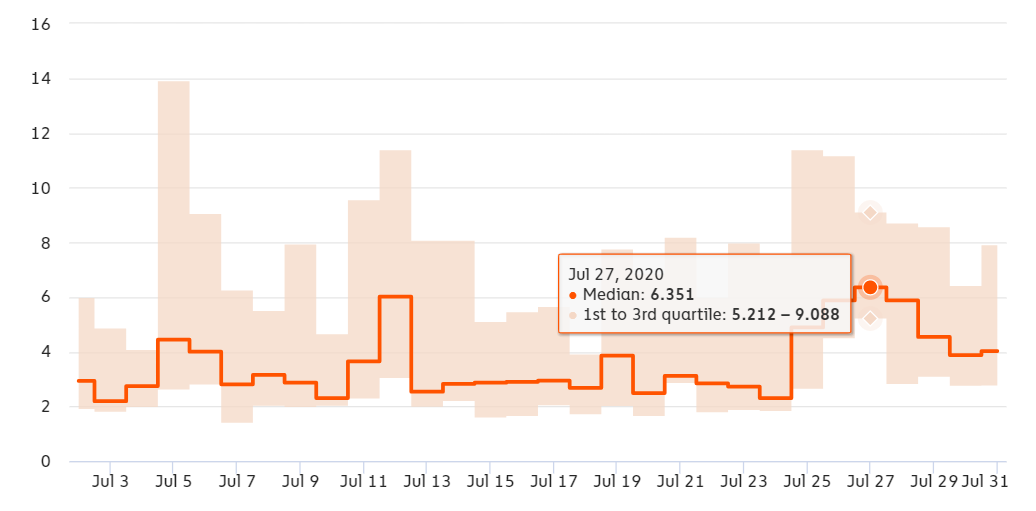
According to data from Chainalysis market insights, the 26 July move peaked the ‘trade intensity’ metric to a massive high of 6.351. Trade intensity measures the order book trades to exchange inflow and an increase in the metric is indicative of either order book trades surging, exchange inflows dropping, or both in tandem.
On the contrary, a fall in the metric would mean decreasing order book trades, increasing exchange inflows, or both in tandem. Since trade intensity is rising during the price increase, it suggests cryptocurrency exchanges are seeing soaring order book trades, despite traders injecting money into exchanges. Hence, an increase in trade intensity suggests “more market participants want to buy than to sell,” which is overall a positive sign for the Bitcoin market.

Bitcoin trade intensity | Source: Chainalysis market insights
With trade intensity jumping to 6.35 Bitcoin, it meant that for every 1 Bitcoin received by exchanges, 6.35 Bitcoin was traded. Here “traded” can either be bought or sold and does not directly refer to the cryptocurrency being liquidated for fiat currency. The opposite is the likely scenario during a price fall, a time when traders would like to sell their Bitcoin for cash. The median trade intensity value of 6.5 was over the 180-day average of 5.3, another positive sign.
However, the intensity soon fell off. As was expected, the trade intensity dropped off quickly after the consolidation as initial trading goals were met and the metric dropped to a low of 3.87 on 31 July. It should be noted that the 3.87 value, while being below the 180-day average, was still higher than the figures in early and mid-July. Further, as the price pushed over $11,500 on the eve of August, the trade intensity metric increased to 4.02.
Why did trading intensity drop so quickly despite the price holding five-figures? Well, given the derivative of the metric, it is likely that order book trades dropped as traders pocketed their profits or exchange inflows rose in greater proportion as more traders put money into their respective trading accounts to benefit from the Bitcoin trend. Since exchange inflows of BTC on exchanges have increased, the latter is true, while the former cannot be completely ruled out either.
As per the chart below, exchange inflows dropped between 27 July [change of 45,800 BTC] and 31 July [change of 32,600 BTC], but was showing an increase as on 1 August.

Bitcoin exchange inflow | Source: Chainalysis market insights
Who is responsible for the increase in trading intensity? Well, given the rise in trading intensity and the immediate fall, after the profits were pocketed, fingers can be pointed at institutional investors. A recent report by Chainalysis published on 31 July read,
“This week’s activity comes after a period where markets looked like they were operating in isolation from external influence, running largely on the internal dynamics of professionals trading amongst themselves rather than being swung by retail sentiment or the actions of long-term investors.”


