Bitcoin’s MVRV highlights holders’ support as Ethereum, XRP struggle

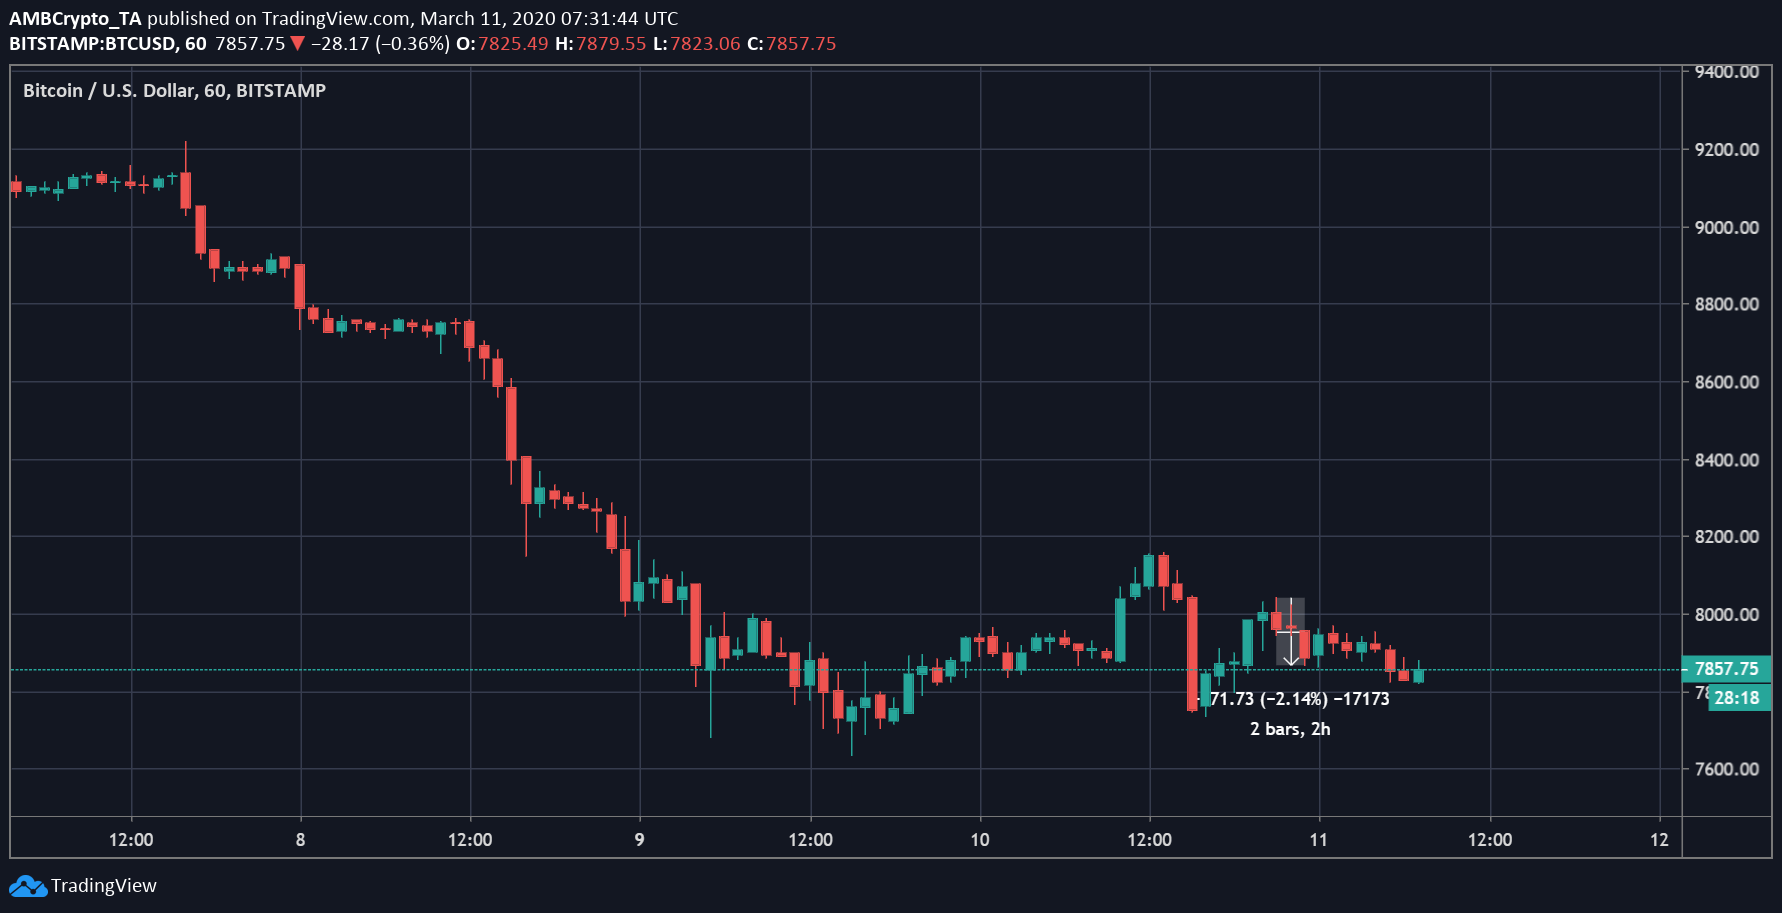
Bitcoin’s price has been slipping with every passing day. On 10 March, the Bitcoin market tried to recover from its fall under $8k, managing to succeed only momentarily. The king coin had climbed to a value of $8,518, following which it noted a 5% fall over the next couple of hours, bringing its valuation down to $7,748.36. While the world’s largest cryptocurrency did touch $8k briefly following a short recovery effort, at press time, Bitcoin was valued at only $7,857.75.

Source: BTC/USD on TradingView
As the price of the world’s largest crypto-asset struggles, an analysis of Market Value to Realized Value [MVRV] becomes more critical towards understanding speculators’ and holders’ behavior. Realized Value, a metric created by Coin Metrics, is calculated by valuing each unit of supply at the price it last moved on-chain i.e. price it was last transacted at.
MVRV is the ratio of a crypto asset’s market cap [aka market value] to realized cap [aka realized value] and can be used to compare the speculator and holder valuation of an asset.
Under the mentioned interpretation, the market cap can be considered as an “estimation of speculators’ current market value (assuming sudden market cap changes are mostly driven by speculation).” On the contrary, the Realized Cap can be used to understand the holders’ market valuation as it reflected price at the time of the last transaction and might not be as affected by sudden price swings.
MVRV has been key to understanding the tops and bottoms of the BTC market historically, according to Coin Metric’s recent research report. Thus, an MVRV ratio above one indicates that speculators have a higher average market valuation than holders, whereas a lower ratio means that holders have a higher market valuation than current speculators.

Source: Coin Metrics
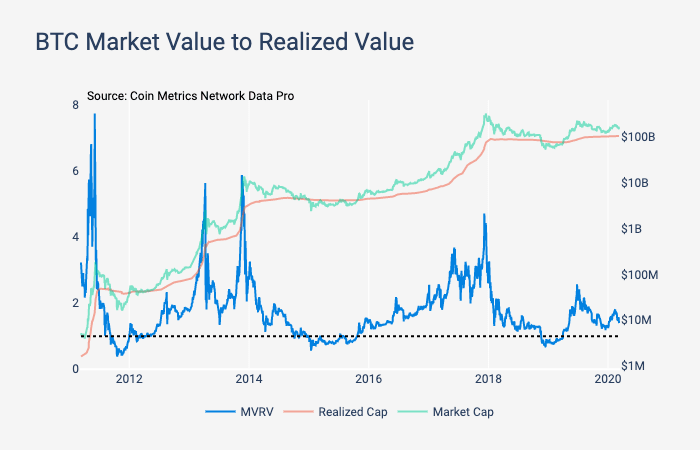
The attached chart reflected that BTC’s MVRV has mostly remained above one, and of the three times it dropped below 0, it managed to rebound. This rebound indicated that long-term support was provided by holders, something that has been balanced out by cycles of speculation. The MVRV analysis of the same reflected healthy patterns of growth, followed by an accumulation period, with the same staying above 1.
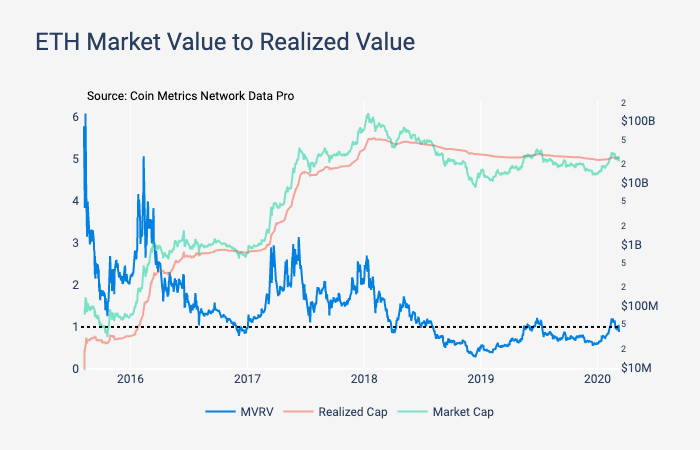
Contradictory to Bitcoin’s chart, Ethereum’s MVRV sunk to 0.3 and remained mostly under 1 throughout 2019. It noted an upwards swing in 2020, but it was falling again at press time.

Source: Coin Metrics
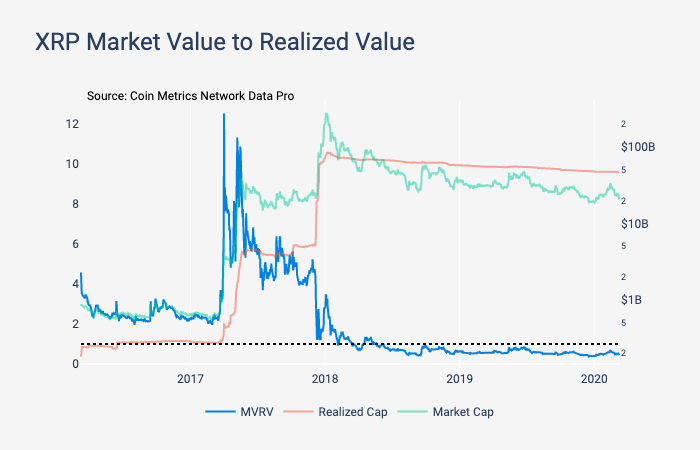
On the other hand, XRP’s MVRV was well above 1 until mid-2018, after which it fell under 0, without having broken the level since. This indicated that speculative enthusiasm for XRP was waning and holders may be underwater.

Source: Coin Metrics


