Analysis
Bitcoin’s first attempt at recovery faces possible rejection at the hands of the 200-day moving average
Bitcoin’s rally to $20,000 was a memorable one. However, the ride down to $3,122 was a rather grueling task for its investors. Perhaps, the best and the most unexpected rally was the April 2019 rally that pushed the price of Bitcoin in a fashion similar to the rally leading up the $20,000. The rejection at this level was more bearish than anticipated, or it will be, depending on how Bitcoin will react henceforth.
Rejection at the 200-DMA

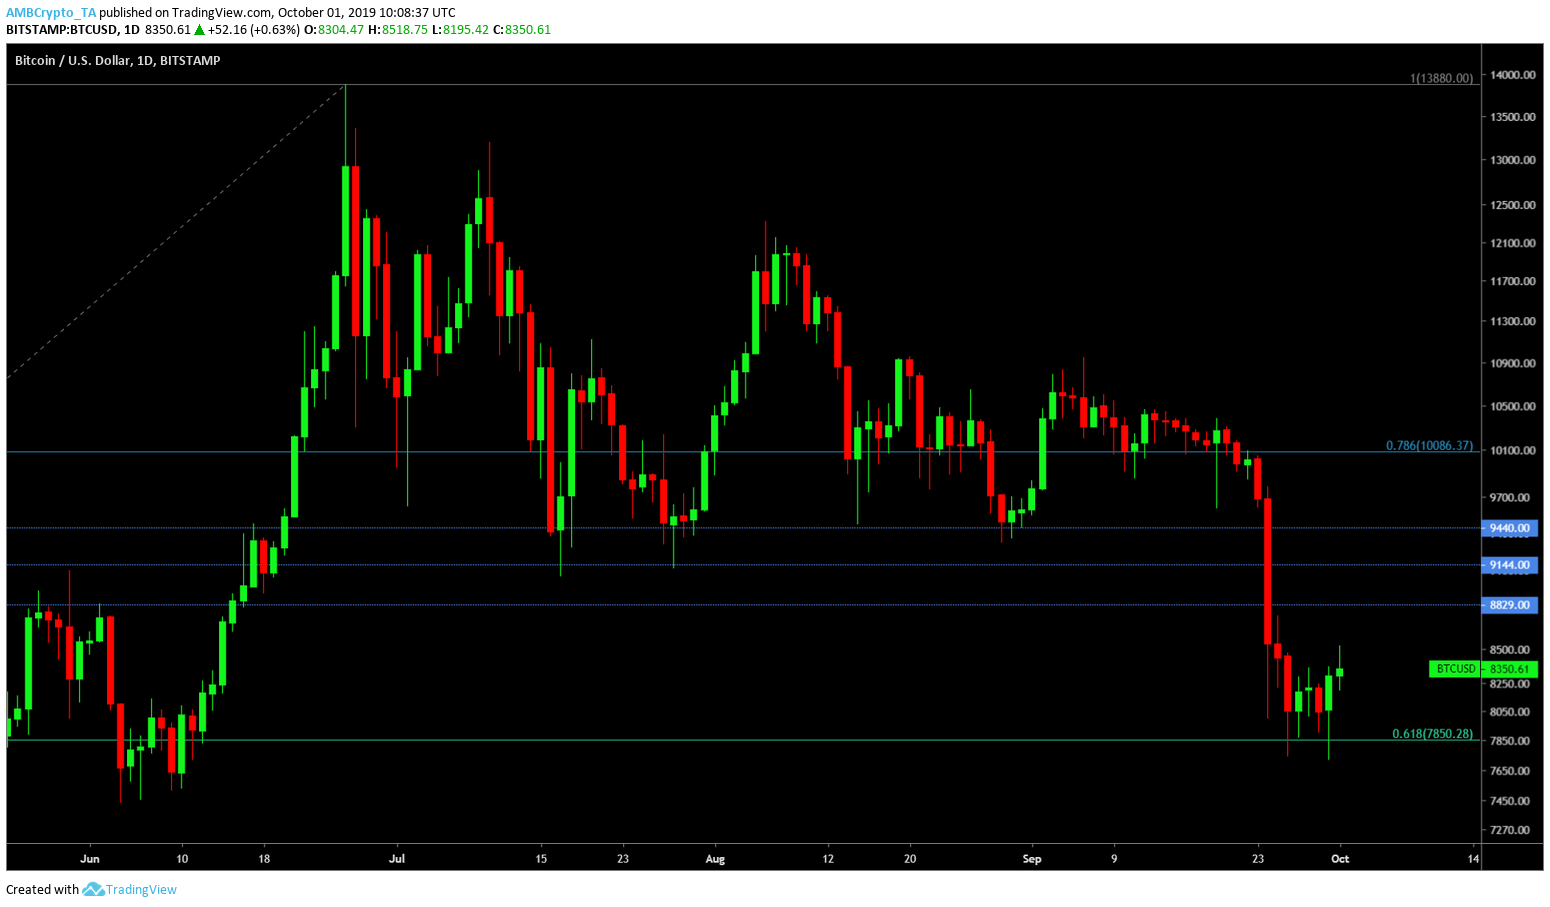
Source: TradingView
Bitcoin’s recent 20% drop caused it to break the $9,400 level and finally hit the $7,000 level, which also happens to be the 0.618-Fibonacci level as explained in the previous article. Over the last 30 hours, Bitcoin has risen by approximately 3.68% and it seems like this is its attempt at recovery. The wick of the current daily candle seems to have surpassed the 200-DMA [Daily Moving Average]. However, the body is still below it.
If Bitcoin can close above this level, the scenario could be flipped and the bulls might take over. But, if the same doesn’t happen, the levels to look at include –
- $6,700 to $6,300, which includes the 0.5-fib level
- $5,200 to $5,000
- $4,440, which includes the 0.236-fib level
However, if the price decides to stay above it, this would mean that Bitcoin could be eying higher highs in the near future. These levels include –
- $8,829
- $9,144
- $9,440
Hourly Chart
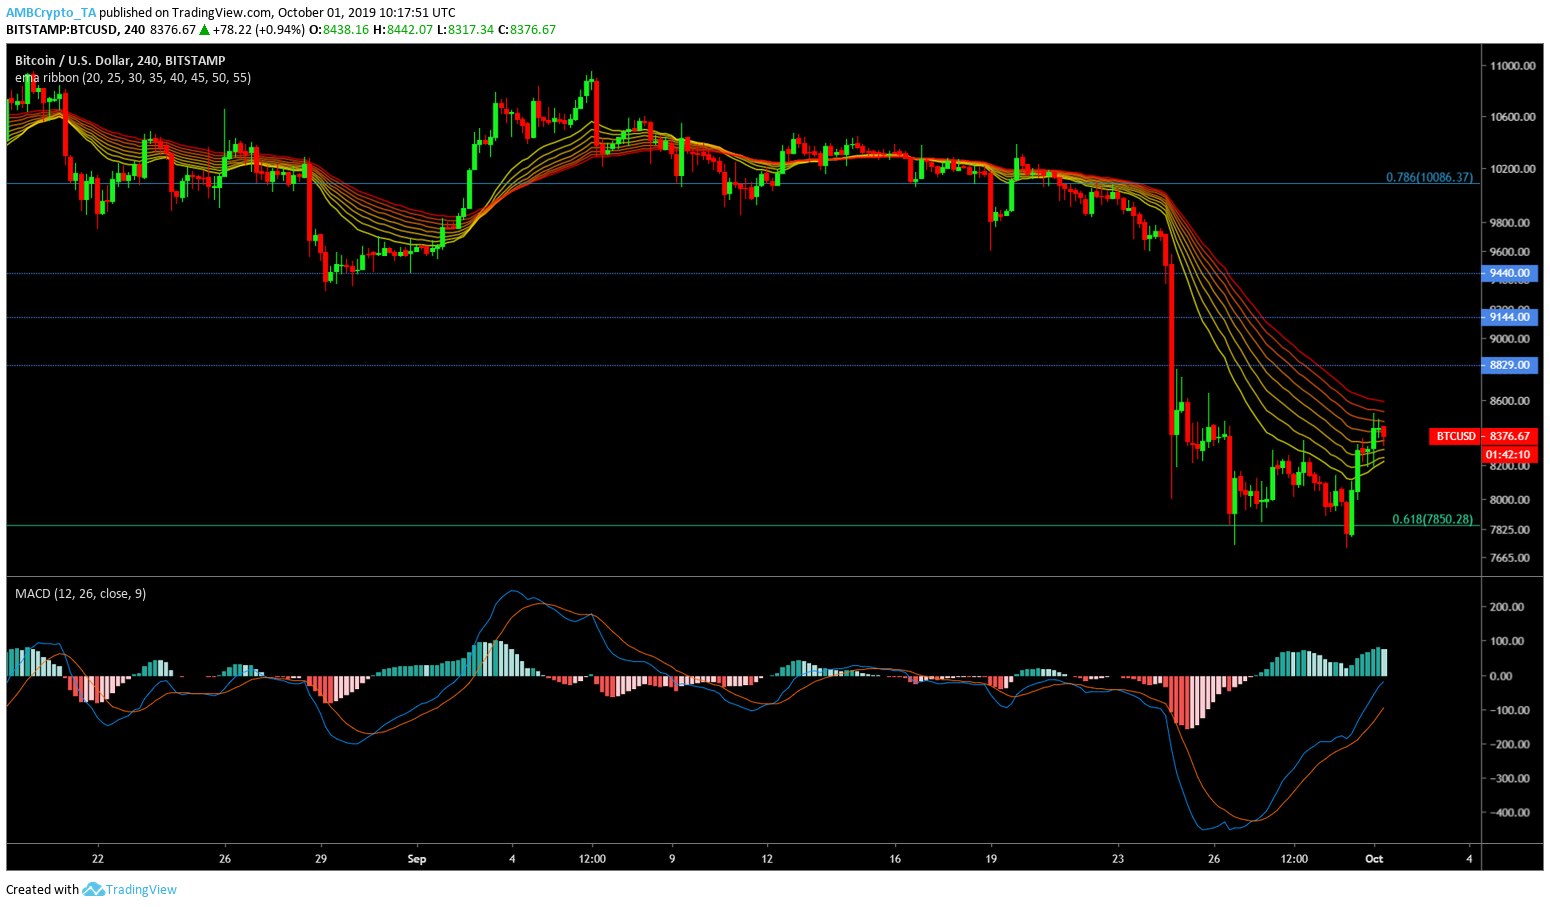
Source: TradingView
Over a slightly lower time frame, the 4-hour chart, BTC is confirming that a change in trend is incoming. However, there is a catch, as the EMA Ribbon is acting as a resistance, making it harder for the price to rise higher. The MACD indicator is also clearly showing signs of recovery.


